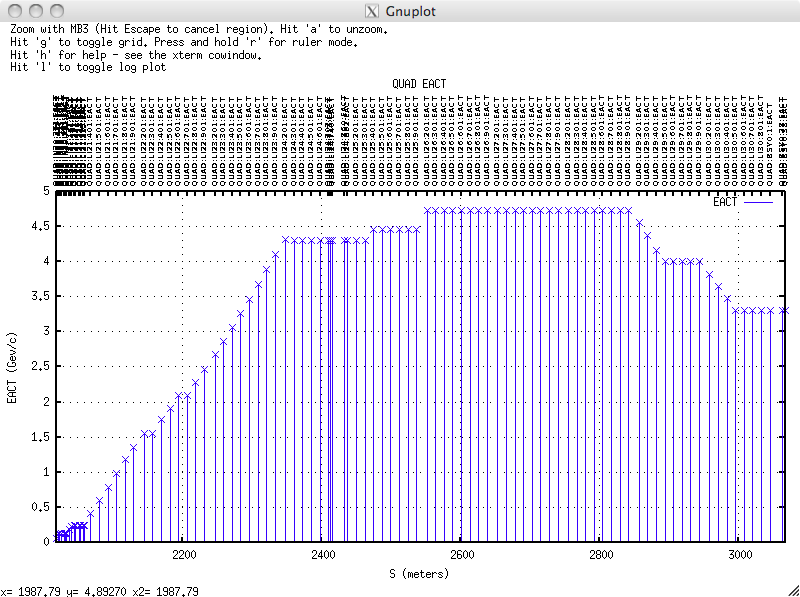
Z-plots are plots of the values of beamline elements (y axis), plotted with respect to their longitudinal position in the beamline (x-axis). It's called a Z-plot because of the coordinate system used in accelerators, where Z is the longitudinal axis of the beamline. So Z position is plotted on the x-axis - yes I know it sounds confusing but it really is simple.
An example is all the EACT (Estimated Energy) at each Quadrupole (QUAD) in the 52SL2 beamline:
Getting a z-plot.
There are two scripts which can be used to get z-plots. One is for modeled devices (plotz) and the other is for devices that have no model (plotz_devices):
$ plotz QUAD EACT                 ! Plots all QUADs' EACT by Z.
$ plotz '(.cor|quad):(in20|li2[1-5])' bdes    ! Plots BDES of all quads and correctors

$ plotz_devices -l VGXX:% P       ! Plots all combined Vacuum Guages (on a log plot)
$ plotz_devices -l PICM:LTU%:% P1_LOSS    ! All the PICM P1_LOSSes in the LTU
Note that they differ in two important respects: plotz can take a full regular expression, plotz_devices can't (plotz_devices can take only a pattern with a '%' wildcard).
Put regular expressions in quotes. This stop the unix shell from trying to interpret it.