Z-plots are plots of the values of beamline elements (y axis), plotted with respect to their longitudinal position in the beamline (x-axis). It's called a Z-plot because of the coordinate system used in accelerators, where Z is the longitudinal axis of the beamline. So Z position is plotted on the x-axis - yes I know it sounds confusing but it really is simple.
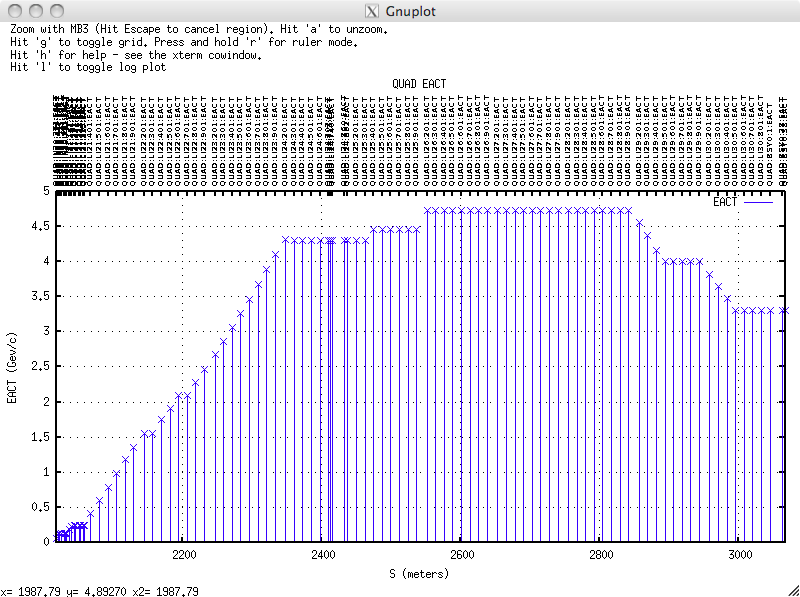
An example is all the EACT (Estimated Energy) at each Quadrupole (QUAD) in the 52SL2 beamline: