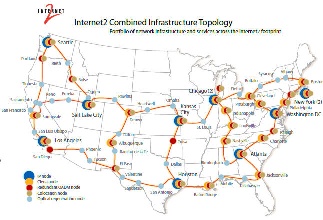
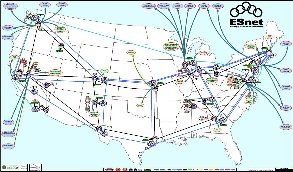
We looked at plots of RTT vs Distance for pairs of Landmarks within 25ms and 1000km radii for Europe and N. America. Europe seemed better behaved. We looked at the network topology for the major Academic and Research (A&R) networks in N. America, i.e. Internet2, ESnet and Canarie. They are shown below.
Internet2 |
ESnet |
Canarie |
|---|---|---|
|
|
|
Our initial results have showed an important insight about the intra regional connectivity for both regions. Our initial results are depicting a better intra regional connectivity in Europe than in North America. Both North America and Europe have many n*Gigabits links connecting one state to another in N.America or one country to another in Europe. But we want to see the state of connecitivity in few hundered miles radius around each landmark. Because in Geolocation last mile network is also very important in improving the accuracty of the technique.
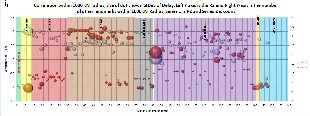
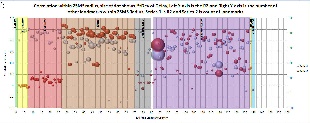
In our analysis first we calculated the correlation coefficient for all landmarks within 1000 KM and 25 MS radii of each landmark. We have also calculate the standard deviation for each landmark and number of other other landmarks within that radii. Below are the two graphs:
Plot within 1000 KM Distance Radius |
Plot within 25 MS Delay Radius |
|---|---|
|
|