By: Les Cottrell SLAC and Qasim Lone NIIT/SLAC
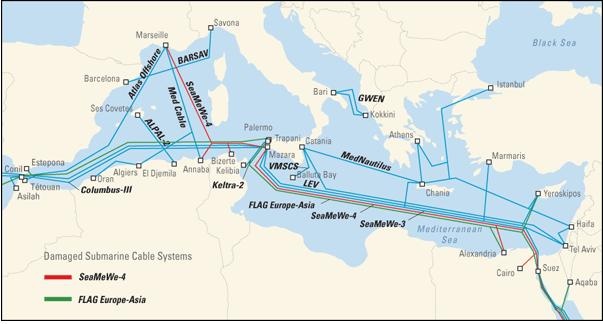
On January 31st, 2008, the NY Times, BBC, The Guardian, CNN and many others reported undersea cable cuts in the Mediterranean. One was damaged near Alexandria, Egypt, and another in the waters off Marseille, France. The two cables were damaged within hours of each other on Wednesday morning of January 30th 2008. Operators believe the damage was caused by ship's anchors during a heavy storm at sea. One of the cables, Sea Me We 4, is owned by 16 telecommunications companies along its route. The second cable, known as the Flag (for Fiber-optic Link Around the Globe) System, runs from Britain to Japan. The cables are separately managed and operated. The outages mainly affected the Middle East and Asia. Most disrupted communications were quickly rerouted through the remaining SEAMEW3 cable or fibres taking the other way around the globe. The cables involved are shown in the Telegeography map below.
We decided to look at the impact on Internet connectivity as seen by the PingER project measurements.
Looking at the hourly ping losses (there are ~20 pings in an hour, so a loss of 1 ping is 5% loss) seen from SLAC for January 30th 2008 for large increases in losses which persisted to the end of the day (to avoid regular diurnal change), the main effects seen are shown in Table 1. The Loss before is the average loss before the outage, the Loss after is the loss after the outage started. The Sites affected is the number of sites monitored in the country that observed an effects, the total is the total number of sites monitored in the country. The impact of such losses can make many applications unusable.
Country |
Loss before |
Loss after |
Sites affected / total |
|---|---|---|---|
Sudan |
< 4.5% |
> 15% |
3/3 |
Bahrein |
0% |
>10% |
2/2 |
UAE |
<4.5% |
>20% |
1/1 |
Jordan |
0% |
>15% |
4/4 |
Oman |
0% |
>15% |
1/1 |
Qatar |
0% |
>4.5% |
1/1 |
Saudi Arabia |
0% |
>4.5% |
2/3 |
India |
0% |
>50% |
2/8 |
Table 1: Hourly Ping Losses
Since the effect may have been transitory while the data was re-routed we looked for increases in losses on January 30th. The effect was seen in about 15 countries of the over 150 countries monitored by PingER. This is shown in Table 2 below.
Country |
Loss before |
Loss after |
Sites affected / total |
|---|---|---|---|
Egypt |
<1% |
>7.5% |
3/3 |
Sudan |
<5% |
>30% |
3/3 |
Hong Kong |
<0.75% |
>11% |
1/1 |
UAE |
<4% |
>18% |
1/1 |
Bahrein |
<1.5% |
>7% |
2/2 |
Jordan |
<3% |
>7% |
3/4 |
Oman |
<8% |
>13% |
1/1 |
Saudi Arabia |
<1.2% |
>7% |
2/3 |
Syria |
<3% |
>7% |
1/1 |
Indonesia |
< 2% |
>8 |
1/7 |
Thailand |
<0.2% |
>8% |
1/6 |
Bangladesh |
<5% |
> 7% |
2/2 |
India |
<3% |
> 40% |
2/8 |
Sri Lanka |
<3% |
>6% |
2/5 |
Maldives |
<1% |
>12% |
1/3 |
Table 2: Daily Ping Losses
The differences between the daily and hourly tables may reflect the sites/countries abilities to switch to alternate routes.
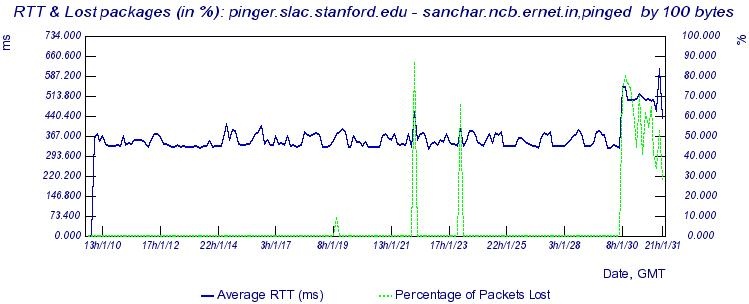
An example of the effect is seen below for a host in Bangalore, India. It can be seen that the Round Trip Time (RTT) went from about 360ms to about 500ms and the losses increased dramatically from close to 0 to 40-60%. Closer inspection shows that for this connection the event occurred between 6:47 and 7:16 am January 30th, 2008 GMT.
The Figure below for a host in the United Arab Emirates shows the impact of the cut and the recovery as the traffic was re-routed. 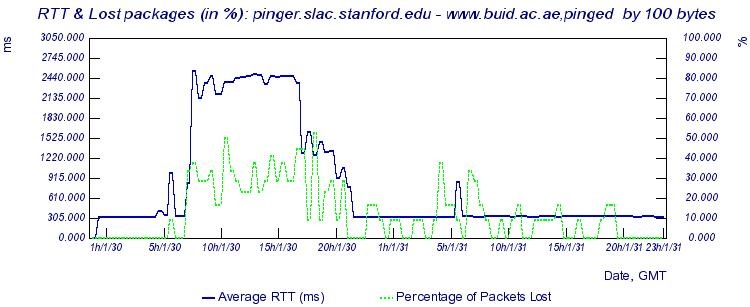
Looking further into data by PingER we can estimate the approximate start time for this event. The exact time is a bit harder to explain but it is generally between 5 AM and 7 AM GMT on January 30th 2008 for most of the countries in table 1 with the only exception of Bahrain where it all started at 9AM. The differences might be due to the measurement sampling rate or monitoring host clock synchronization issues.
PingER calculates throughput of different nodes from the Round Trip Time (RTT) and loss using the Mathis formula. It is interesting to see the effect on throughput of the regions suffered from fibre outage. Below is the table which gives us insight on the throughput of countries affected by this outage.
Countries |
Throughput before (kbits/s) |
Throughput after (kbits/s) |
Sites affected / total |
|---|---|---|---|
UAE |
1200 |
21 |
1/1 |
Bahrain |
800 |
23 |
2/2 |
Jordan |
500 |
30 |
3/4 |
Oman |
125 |
18 |
1/1 |
Saudi Arabia |
800 |
30 |
2/3 |
Bangladesh |
400 |
35 |
2/2 |
India |
800 |
38 |
2/8 |
The above table shows the average of throughput before and after the start of the fibre outage. The results clearly show order of magnitude reductions in throughput.
Another view of the changes is seen in the map below showing the throughputs before (Jan-Sep 2007) and after (Jan 30 2008). Bear in mind that the fact the outage did not start until around 6:00am, and re-routing traffic before the end of the day will both dilute the effect. Also the effects were not uniform on all hosts in a country.
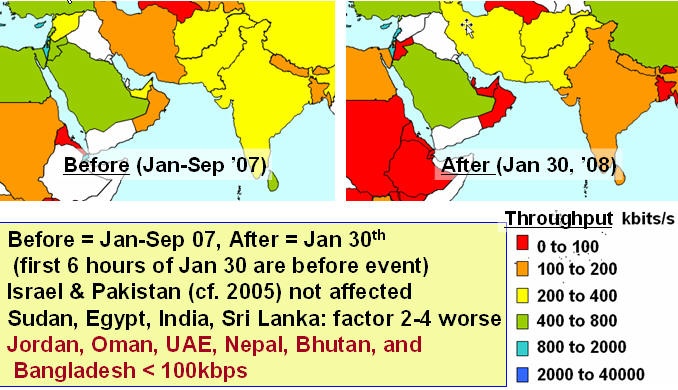
It is interesting that some countries such as Pakistan were mainly unaffected, despite the impact on neighboring countries such as India. This contrasts dramatically to the situation in June - July 2005, when due to a fibre cut of SEAMEWE3 off Karachi, Pakistan lost all terrestrial Internet connectivity which resulted in many cases in a complete 12 day outage of services. This is a tribute to the increased redundancy of international fibre connectivity installed for Pakistan in the last few years.
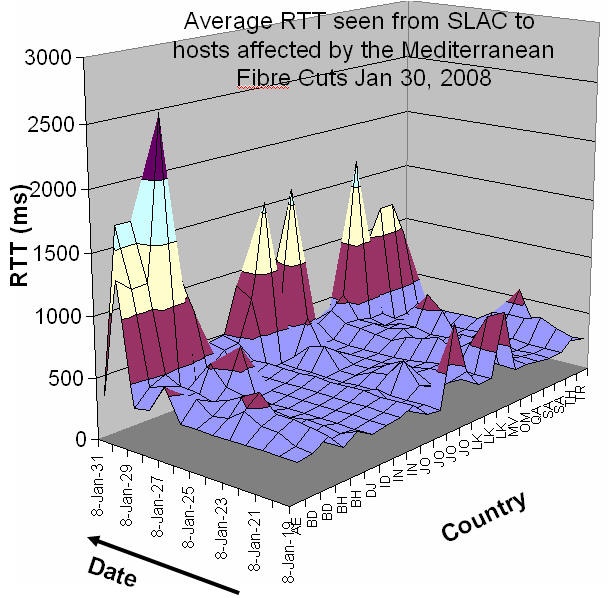
One can also see the effect by looking at the RTTs for affected hosts as a function of time. This is seen below where we plot the daily RTT seen from SLAC versus the date and the Top Level Domain (TLD) of the country the host is located in. It is seen taht there is a big spike going from around 300 ms to over 1000 ms for January 30th, followed by recovery in several cases. The main countries affected are the United Arab Emirates (AE), Bangladesh (BD), Bhutan (BH), Djibouti (DJ), Indonesia (IN), Jordan (JO), Sri Lanka (LK), the Maldives (MV), Oman (OM), Saudia Arabia (SA), Thailand (TH) and Turkey (TR).