Fibre cuts the Mediterranean were reported by many sources including the BBC, also Blomberg News, and Wired on December 18th 2009. We decided to have a look at the impact on ping performance using the PingER data.
For performance issues following the previous Mediterranean fibre cut see:
https://confluence.slac.stanford.edu/display/IEPM/Effects+of+Fibre+Outage+through+Mediterranean
Losses
The measured effects on the losses seen from N. America (SLAC in California) to hosts in N. Africa (Egypt, Sudan); Middle East (Bahrein, Palestine, UAE, Oman, Jordan, Lebanon, Saudia Arabia); S. Asia (Sri Lanka, Maldives, Pakistan) are huge. As seen from PingER daily loss data measured from SLAC, comparing the losses on Friday Dec 19 with those on Mon-Thu (15-18 Dec) the losses have increased by a factor of 5 to 30 times for most of the hosts monitored in the above countries.
Round Triup Time (RTT)
An example of the increase in RTT can be seen below in the plot of RTT seen from SLAC to a node in Egypt. The sudden change in RTT from ~ 244ms to almost 400ms can be seen around 9-10am on Friday Dec 19th 2009. 
Another view of the effect of the RTT increases is seen in the plot below of the median RTTs measured (thed error bars are the 25% and 75%-tiles) from 3 monitoring hosts in Pakistan (NUST, COMSATS and NCP) to FNAL and SLAC (i.e. 6 pairs of monitor/remote hosts) for the first 19 days of December 2008. 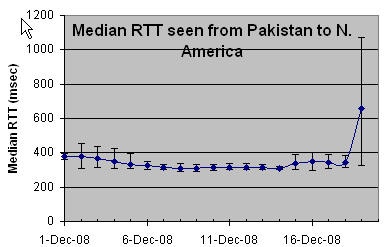
Traceroutes from SLAC to Egypt
Following the outage the routes changed dramatically and pretty often as the carriers found alternate routes. Before then cut the routes went Eastwards across the US via ESnet, then via GEANT to Egypt. Immediately following the traffic still went Eastwards but via NTT and FLAG, later it want Westwards from Palo Alto in California to Tokyo and Hong Kong using FLAG. Later still TATA picked up the route and it went via Singapore rahther thah Hong Kong.
TCP Throughput
We derive the throughput from the loss and RTT measurements as decribed elsewhere. We then calculate the impact as:
Impact = median(derived_throughput for Dec 19-20) / median(derived_throughput for Dec 1-18)
This was sorted by Impact to create the following table of the worst affected countries:
Country |
Impact |
Oman |
1.89% |
Sudan |
2.79% |
Cape Verde |
3.26% |
Egypt |
3.72% |
Jordan |
4.06% |
Bahrain |
8.24% |
Sri Lanka |
19.41% |
Ethiopia |
24.03% |
Pakistan |
24.32% |
Reunion-French Colony |
26.21% |
Libya Arab Jamahiriya |
28.72% |
Bangladesh |
28.89% |
United Arab Emirates |
31.04% |
Malta |
31.28% |
The derived throughpus as a function of time for these countries are shown below in a contour plot. The drastic reduction occuring December 19-20 2008 is quickly seen to the left. 