Command to start
ami-local -b 1 -f interval=1 psana://exp=tmoc00118,run=222,dir=/cds/data/psdm/prj/public01/xtc
Finding control nodes for this example
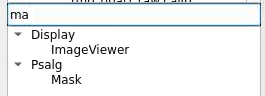
Mask
Mask (2D or 3D array) is created mainly from calibration constants of particular detector.
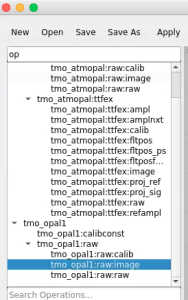
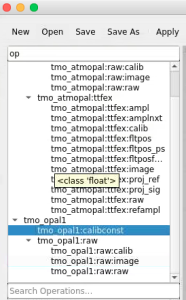
For example, bring control nodes to the flowchart and connect their terminals as shown below.
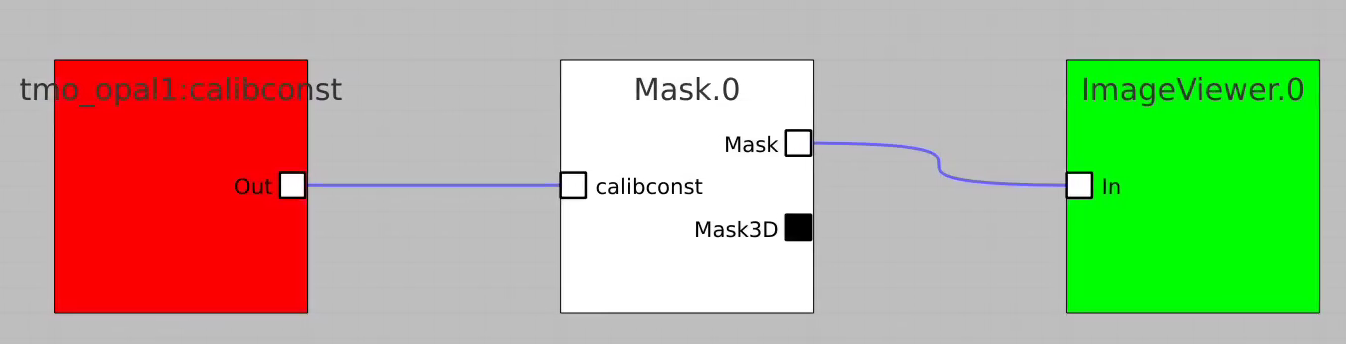
Click on "Apply" button, then click on Mask.0 and ImageViewer.0 control nodes to open editor for mask parameters and mask image viewer.
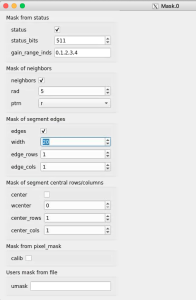
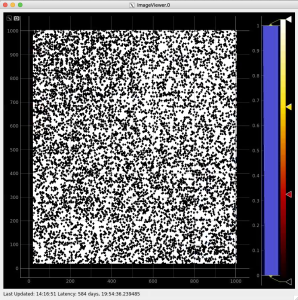
Adjust the mask parameters using editor window and click on "Apply" button again. Mask image will have changed according to set parameters.
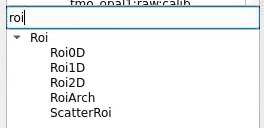
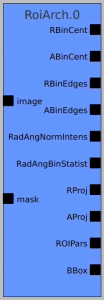
RoiArch
Simple example
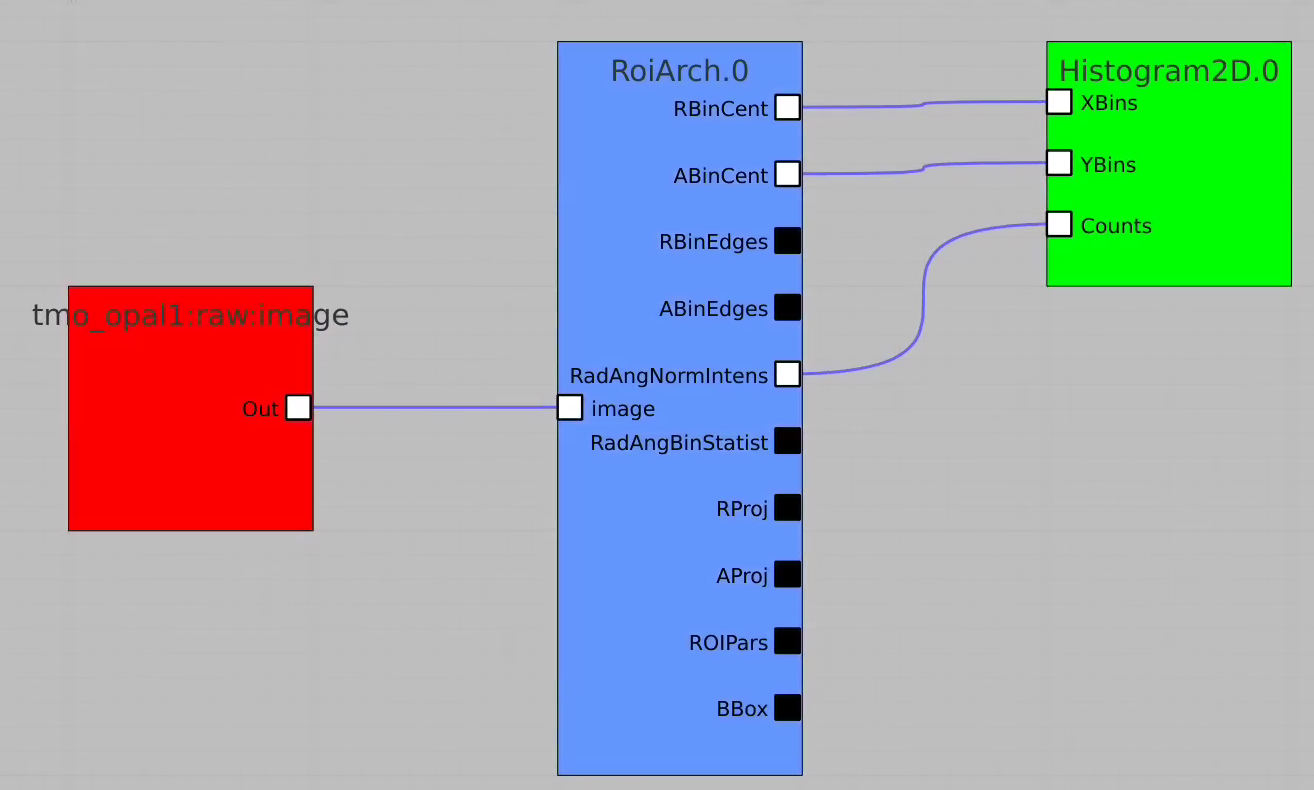
In simple case we use 2D image as input array without mask and ImageViewer with bin numbers in stead of actual scales for radial and angular dimensions.
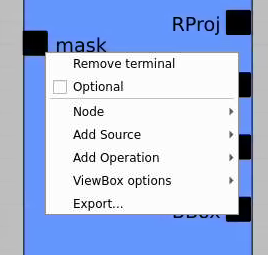
First, bring RoiArch to the flowchart, right-click on input "mask" terminal and select "Remove terminal" on pop-up window. (Currently ami2 does not work with optional terminals).
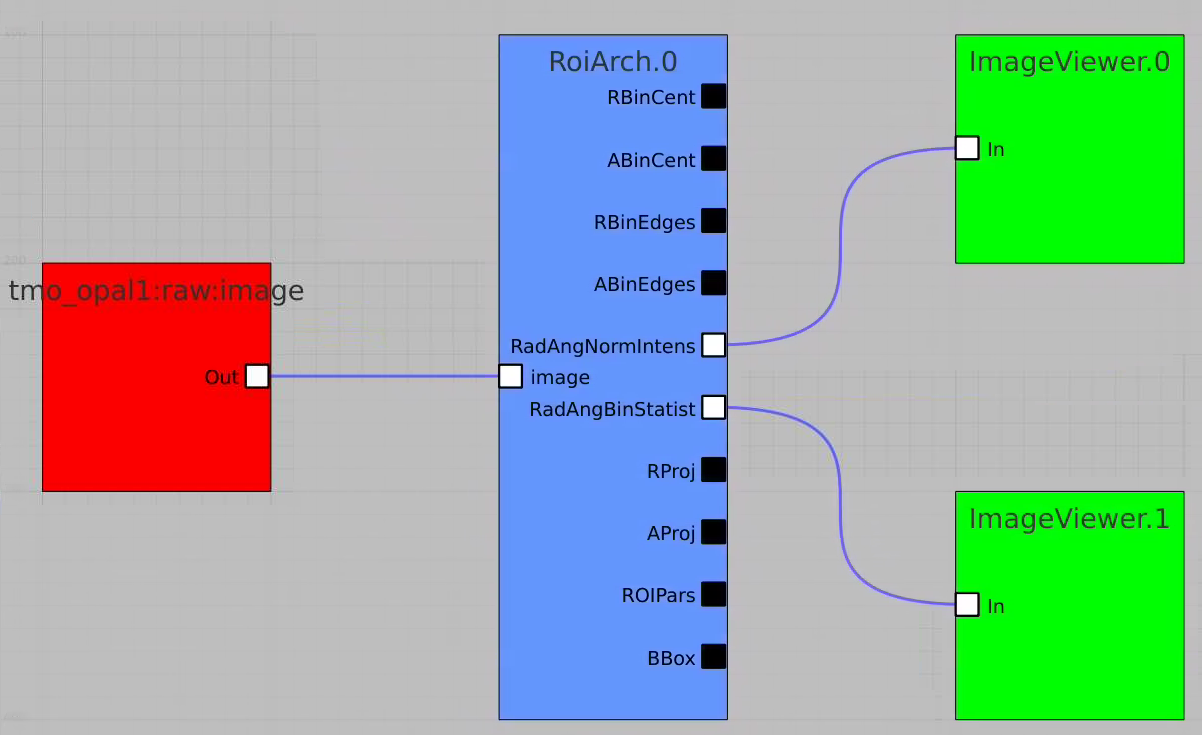
Bring other control nodes to the flowchart and connect them as shown below and click on "Apply" button.
Click on RoiArch control node and adjust desired ROI region on pop-up window.
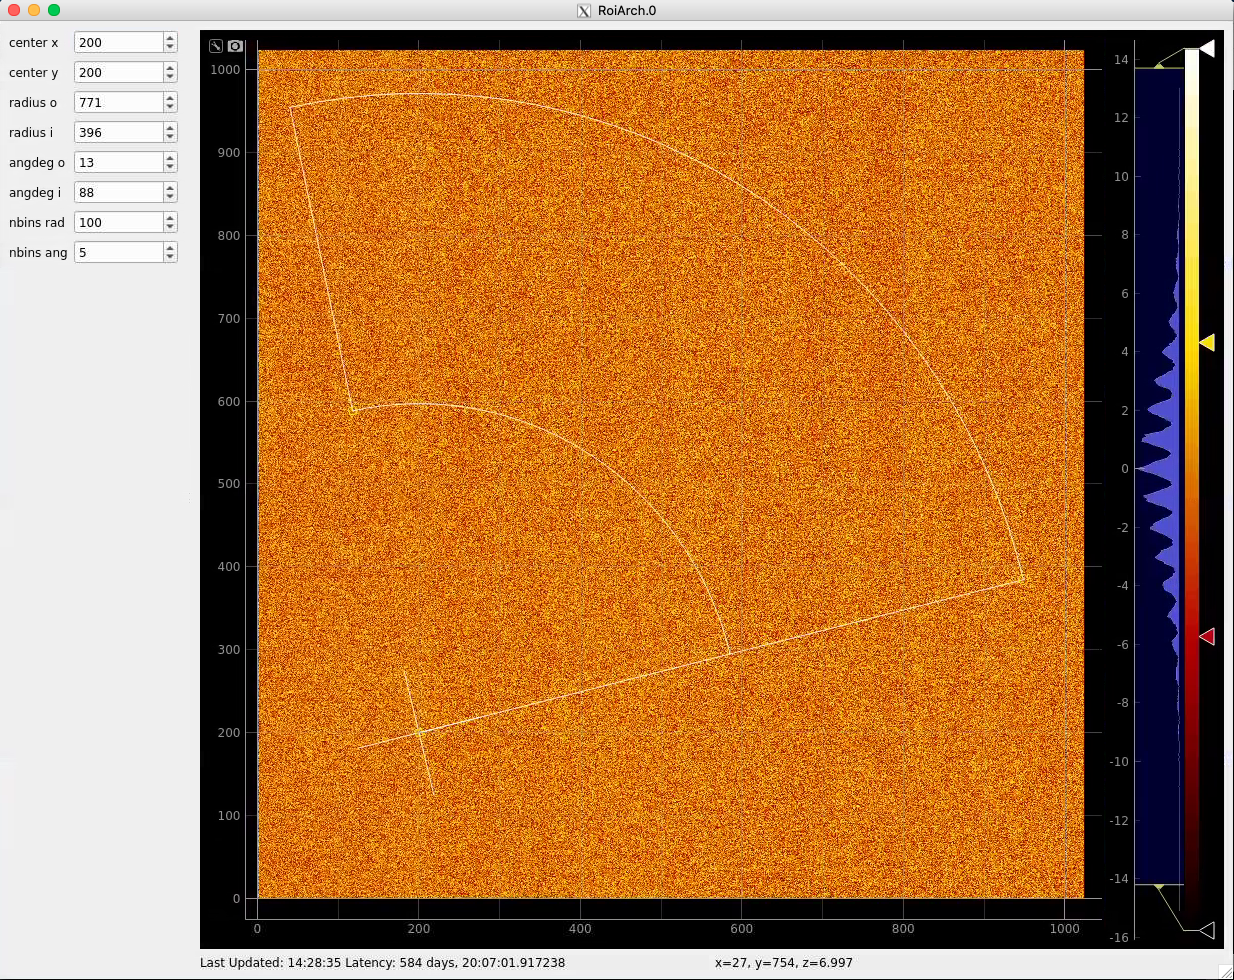
Image can be moved and zoomed by click-and-drag and scrolling mouse, respectfully.
ArchROI can be adjusted using 3 control points for center, external radius and entire rotation, internal radius and arch angular size. Alternatively, ArchRoi parameters can be adjusted using editor for parameters in the left side of the window. Click on "Apply" button after mask parameters are set.
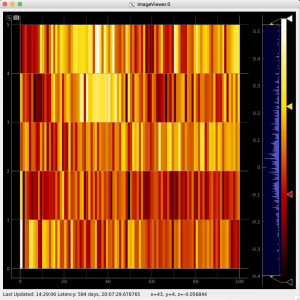
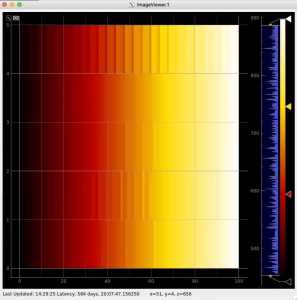
Then click on ImageViewer.0 and ImageViewer.1 control nodes to see images for r-angle per pixel normalized intensity and associated pixel per bin statistics.
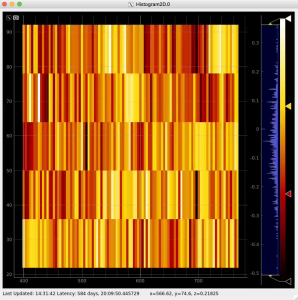
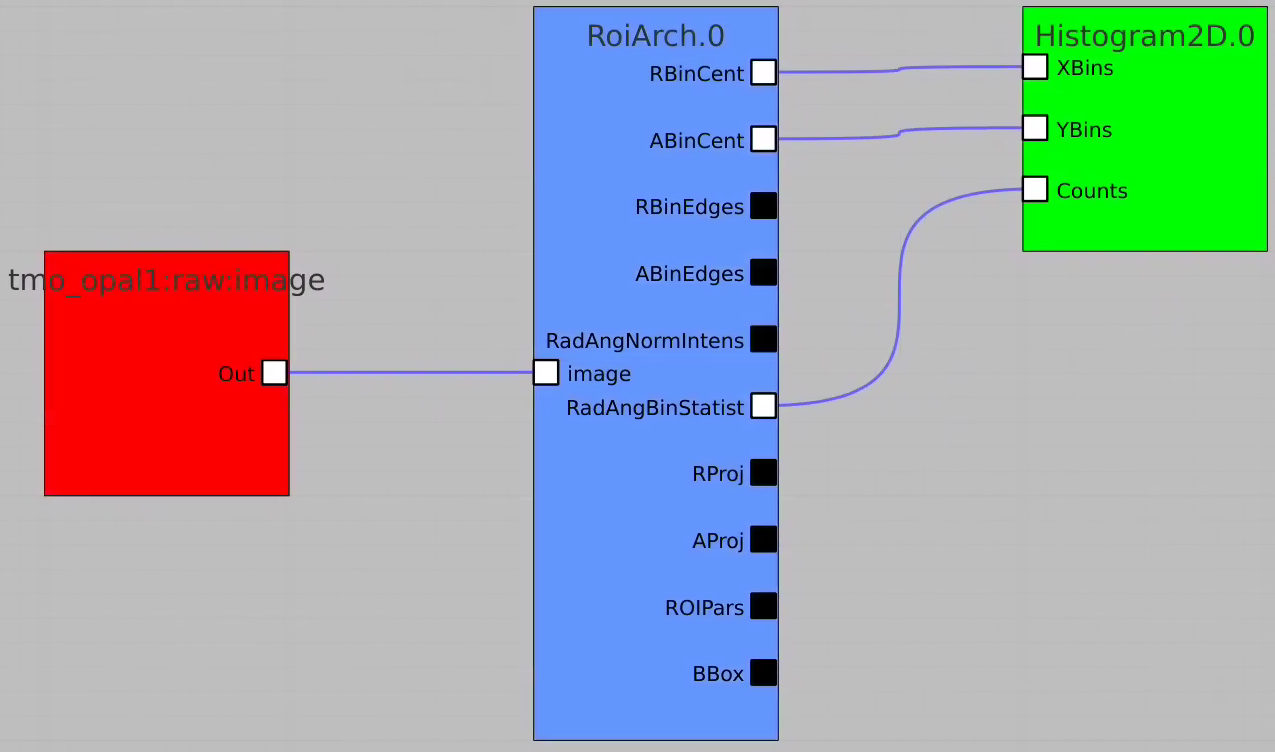
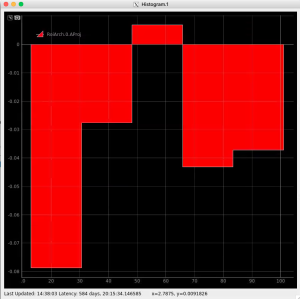
Plot radial-angular distribution with scales scale
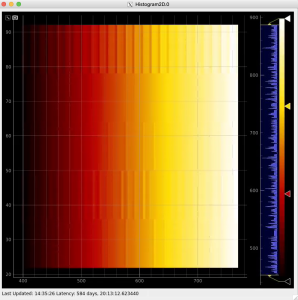
R-angular plot with scales for normalized intensity
R-angular plot with scales for per-bin pixel statistics
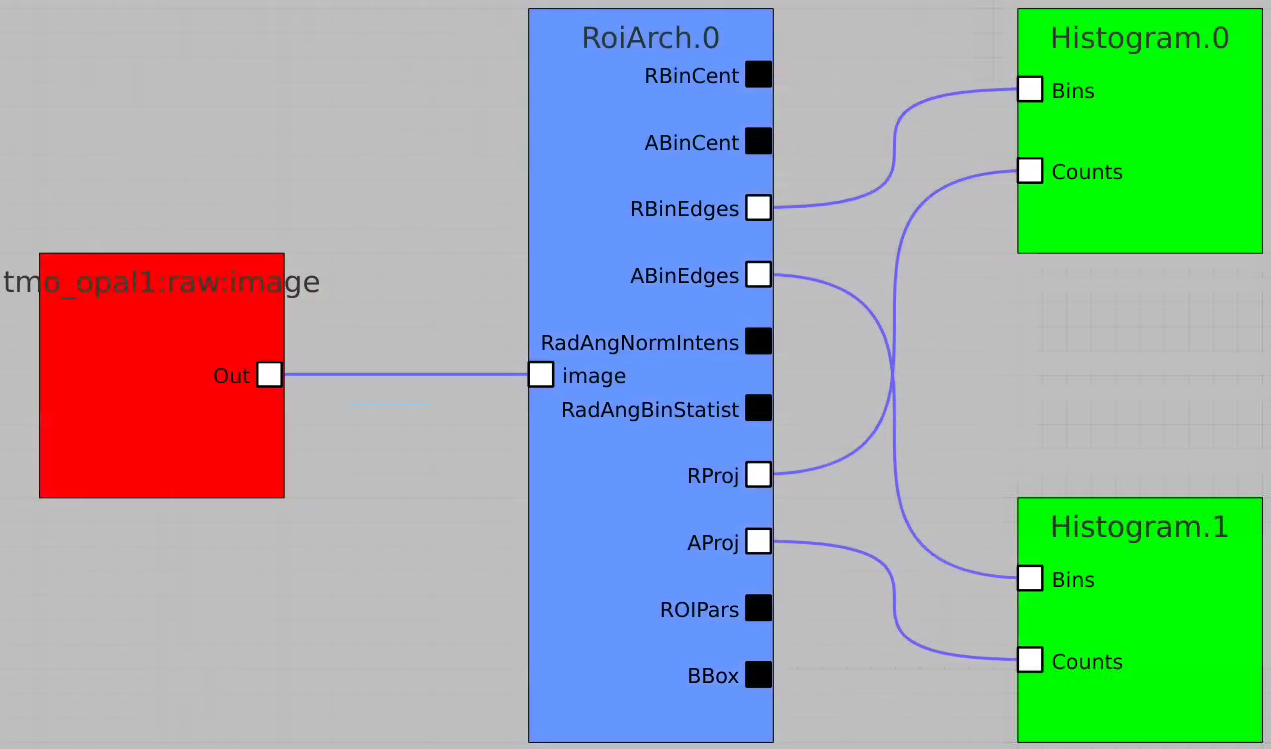
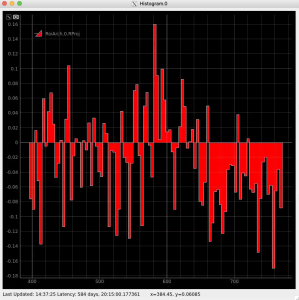
Radial and angular projections with normalized per pixel intensity
Arrays of N+1 bin edges should be used for 1D histograms
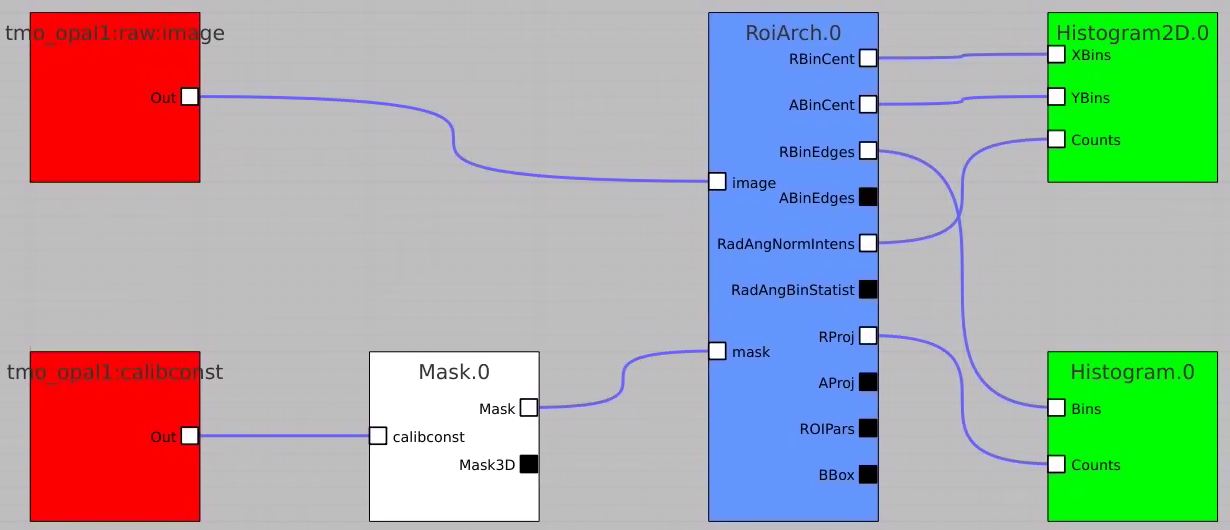
Apply mask
Bring RoiArch to the flowchart, connect th Mask.0 control node output (2D) Mask with RoiArch "mask" input terminal.
Then build other control nodes as in previous examples, click on "Apply" button, etc.
References
Overview
Content Tools