Introduction
The PingER Monitoring Node Count Intensity Maps present a heat map of the number of PingER monitoring nodes spread over the world. These charts were generated using the information maintained by the PingER database. The same information may be viewed in the form of an overlay over Google Maps.
The charts were generated using the Google Visualization API for Intensity Maps.
An example of the charts is shown below:
PingER Monitoring Node Count |
|---|
|
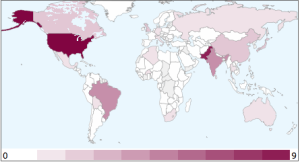
Interpretation
The numerical values labeling each chart (shown at the bottom) define the minimum (left) and the maximum (right) number of nodes that a country may host. For example USA hosts 9 monitoring nodes. Details of these monitoring sites may also be obtained from here. The magnified versions of the map presents the same information by zooming-in over regions (as defined by the Google Visualization API).