daqPipes and daqStats
Useful commands from Ric for looking at the history of DAQ Prometheus data:
daqStats -p 0 --inst tmo --start '2020-11-11 13:50:00'
daqPipes -p 0 --inst tmo --start '2020-11-11 13:50:00’
If you leave the —start off, then you get the live/current data.
Once either of these apps are running, hitting ‘h’ will give you help with the allowed keystrokes and what the columns mean.
Data Flow and Monitoring
A useful diagram of the pieces of a DRP node that should be monitored via prometheus is here: https://docs.google.com/presentation/d/1LvvUsV4A1F-7cao4t6mzr8z2qFFZEIwLKR4pXazU3HE/edit?usp=sharing
Generic
- "clearreadout" and "clear"
- need to reset the Rx/Tx link (in that order!) for XPM front-panel (note: have learned that RxLink reset can cause link CRC errors (see below) and have to do a TxLink reset to fix. so order is important). The TxLink reset causes the link to retrain using K characters
- look for deadtime
- check that the "partition" window (with the trigger-enable checkbox) is talking to the right XPM: look in the XPM window label, which is something like DAQ:LAB2:XPM:N, where N is the XPM number. A symptom of this number being incorrect is that the L0InpRate/L0AccRate remain at zeros when triggers are enabled. This number is a unique identifier within a hierarchy of XPMs.
- XPM is not configured to forward triggers ("LinkEnable" for that link on the XPM GUI)
- L0Delay set to 99
- DST Select (in PART window) set to "DontCare" (could be Dontcare/Internal)
- check processes in lab3-base.cnf are running
- run psdaq/build/psdaq/pgp/kcu1500/app/kcuStatus and kcuDmaStatus in kcuDmaStatus "blockspause" and "blocksfree" determine whether or not deadtime is set. if blocksfree drops below blockspause then it will assert deadtime. in hsd window "pgp last rx opcode" 0 means no backpressure, 1 means backpressure. Watch for locPause non zero which causes deadtime.
- check for multiple drp executables
- clearReadout broadcasts a message to receiving kcu's telling them to reset timing-header FIFOs.
- if running "drp" executable, check that lane mask is correct
- if events are showing up "sporadically" look for CRC errors from "kcuSim -s -d /dev/datadev_0". We have seen this caused by doing an XPM RxLink reset without a later TxLink reset.
for the pgp driver this parameter needs to be increased in /etc/sysctl.conf:
[root@drp-neh-cmp005 cpo]# grep vm /etc/sysctl.conf
vm.max_map_count=1000000
[root@drp-neh-cmp005 cpo]#
kcu1500 (timing system or "sim")
- kcuSim -t (resets timing counters)
- kcuSim -s (dumps stats)
- Watch for these errors: RxDecErrs 0 RxDspErrs 0
- reload the driver with "systemctl restart tdetsim"
- currently driver is in /usr/local/sbin/datadev.ko, should be in /lib/modules/<kernel>/extra/
- reloading the driver does a soft-reset of the KCU (resetting buffer pointers etc.).
- if the soft-reset doesn't work, power-cycle is the hard-reset.
configdb Utility
From Chris Ford. See DAQ configdb CLI Notes. Supports ls/cat/cp. For example:
configdb cp --user rixopr --password <usual> tmo/BEAM/tmo_atmopal_0 rix/BEAM/atmopal_0
Firmware
NOTE: Some KCU firmware (notably the hsd image named DrpPgpIlv) is reprogrammed over /dev/datadev_1. Also, some images don't automatically detect the prom type. A general KCU firmware reprogramming command would be:
python software/scripts/updatePcieFpga.py --path /reg/neh/home/cpo/junk --type SPIx8 --dev /dev/datadev_1
As of Jan. 20, 2021, Matt has firmware here:
- ~weaver/DrpTDet-20200612*.mcs (tdetsim)
- /afs/slac/u/ec/weaver/projects/cameralink-gateway/firmware/targets/ClinkKcu1500Pgp2b/images/ClinkKcu1500Pgp2b-0x04090000-20201125220148-weaver-dirty*.mcs (timetool opal, but compatible with normal opal ... he will merge into Larry's repo).
datadev Driver
- user "systemctl list-unit-files" to see if tdetsim.service or kcu.service is enabled
- associated .service files are in /usr/lib/systemd/system/
- to see if events are flowing from the hardware to the software: "cat /proc/datadev_0" and watch "Tot Buffer Use" counter under "Read Buffers"
- if you see the error "rogue.GeneralError: AxiStreamDma::AxiStreamDma: General Error: Failed to map dma buffers. Increase vm map limit: sysctl -w vm.max_map_count=262144". This can be caused by that parameter being too low, but it can also be caused by loading the driver with CfgMode=1 in tdetsim.service (we use CfgMode=2). This CfgMode parameter has to do with the way memory gets cached.
- make sure the tdetsim.service is the same as another working node
- make sure that the appropriate service is enabled (see first point)
- check that the driver in /usr/local/sbin/datadev.ko is the same as a working node
- check that /etc/sysctl.conf has the correct value of vm.max_map_count
- we have also seen this error when the datadev.ko buffer sizes and counts were configured incorrectly in tdetsim.service.
An example tdetsim.service for an opal camera:
drp-neh-cmp012:~$ more /usr/lib/systemd/system/tdetsim.service
[Unit]
Description=SimCam Device Manager
Requires=multi-user.target
After=multi-user.target

[Service]
Type=simple
ExecStart=/usr/local/sbin/kcuSim -s -d /dev/datadev_0
ExecStartPost=/sbin/insmod /usr/local/sbin/datadev.ko cfgTxCount=4 cfgRxCount=40
96 cfgSize=0x210000 cfgMode=0x2
ExecStop=
KillMode=process
IgnoreSIGPIPE=no
StandardOutput=syslog
StandardError=inherit

[Install]
WantedBy=multi-user.target
HSD
- look at configured parameters using (for example) "hsdpva DAQ:LAB2:HSD:DEV06_3D:A"
- for kcu firmware that is built to use both QSFP links, the naming of the qsfp's is swapped. i.e. the qsfp that is normally called /dev/datadev_0 is now called /dev/datadev_1
- HSD is not configured to do anything (Check the HSD config tab for no channels enabled)
- if hsd timing frames are not being received at 926kHz (status here), click TxLink Reset in XPM window. Typically when this is an issue the receiving rate is ~20kHz.
- The HSD configuration partition number does not match platform number in .cnf file (Check the HSD "base" tab)
- also check that HEADERCNTL0 is incrementing in "status" tab of HSD cfg window.
- in hsd window timepausecnt is number of clocks we are dead
- in hsd expert window "full threshold(events)" sets threshold for hsd deadtime
- in hsd status window "fex free events" and "raw free events" are the current free events.
- in hsd status window "write fifo count" is number of timing headers waiting for HSD data to associate.
- "readcntsum" on hsd timing tab goes up when we send a transition OR L1Accepts. "trigcntsum" counts L1Accepts only.
- check kcuStatus for "locPause" non-zero (a low level pgp FIFO being full). If this happens then: configure hsd, clear readout, reboot drp node with KCU
update on variables in hsdpva gui from Matt (06/05/2020):
- timing tab
- timpausecnt (clock ticks of dead time)
- trigcnt: triggers over last second
- trigcntsum: total l1accept
- readcntsum: number of events readout total
- msgdelayset: (units: mhz clock ticks) should be 98 or 99 (there is an "off by one" in the epics variable, and what the hsd sees). if too short, trigger decision is made too early, and there isn't enough buffering in hsd (breaks the buffer model)
- headercntof: should always be zero (ben's module). non-zero indicates that too many l1accepts have been sent and we've overwritten the available buffering
- headercntl0: sum of number of headers received by ben's module.
- headerfifor: the watermark for when ben's stuff asserts dead time
- fulltotrig/nfulltotrig: counters to determine the round trip time from sending an event to getting back the full signal (depends on fiber lengths, for example). nfulltotrig is same thing but with opposite logic.
- pgp tab
- loclinkrdy/remlinkrdy should be ready
- tx/rx clk frequencies should be 156.
- txcnt: counts per second of things being send, but only 16 bits so doesn't really display right value
- txcntsum is transitions and l1accepts (only 16 bits so rolls over frequently)
- buffers tab
- freesz: units of rows of adc readout (40samples*2bytes).
- freeevt: number of free events. if they go below thresholds set in config tab: dead time.
- flow tab
- fmask: bit mask of streams remaining to contribute to event
- fcurr: current stream being read
- frdy: bit mask of streams ready to be read
- srdy: downstream slave (byte packer) is ready
- mrdy: b0 is master valid assert, b1 is PGP transmit queue (downstream of byte packer) ready
- rdaddr: current stream cache read pointer
- npend: next buffer to write
- ntrig: next buffer to trigger
- nread: next buffer to read
- pkoflow: overflow count in byte packer
- oflow: current stream cache write pointer
On Nov. 18, 2020 saw a failure mode where hsd_4 did not respond on configure phase 2. Matt tracked this down to the fact that the kcu→hsd links weren't locked (visible with "kcuStatus" and "hsdpva"). Note that kcuStatus is currently not an installed binary: has to be run from the build area. This was caused by the fact that we were only running one-half of a pair of hsd's, and the other half is responsible for setting the clock frequencies on the kcu, which is required for link-lock. We set the clock frequencies by hand running "kcuStatus -I" (I for Initialize, I guess) on the drp node. Matt is thinking about a more robust solution.
Cable Swaps
hsd cables can be plugged into the wrong place (e.g. "pairs" can be swapped). They must match the mapping documentation Matt has placed at the bottom of hsd.cnf (which is reflected in the lines in hsd.cnf that start up processes, making sure those are consistent is a manual process). Matt has the usual "remote link id" pattern that can be used to check this, by using "kcuStatus" on the KCU end and "hsdpva" on the other end. e.g.
psdev01:~$ ssh drp-neh-cmp020 ~/git/lcls2/psdaq/build/psdaq/pgp/kcu1500/app/kcuStatus | grep txLinkId
            txLinkId : fb009c33 fb019c33 fb029c33 fb039c33 fb049c33 fb059c33 fb069c33 fb079c33
psdev01:~$
The lane number (0-7) is encoded in the 0xff0000 bits. The corresponding hsdpva is:
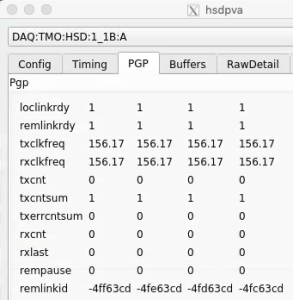
Unfortunately, the remlinkid is currently displayed as a signed integer, so to see the real value on has to calculate, for example, 0x100000000-0x4ff63cd=0xfb009c33 (see output of kcuStatus txLinkId above)
Missing Configuration of KCU Clock Speeds (KCU links not locking)
The clock speed is programmed via datadev_1, so if only a datadev_0 is included then the pgp link between KCU and HSD will not lock. It currently requires the corresponding datadev_1 to be in the cnf file.
Zombie HSD Causing Deadtime
Multi-opal can have this problem too. Can get dead time from an hsd that is not included the partition (or has been removed from the cnf). In the case, the "zombie" has a stuck "enable" bit in the hsdpva config tab. Options:
- segment level should "disable" on restart
- will still have problems when the zombie hsd is removed from the cnf
- better: can also disable on control-C signal (handles case where hsd is removed from cnf)
- another possibility: the collection mechanism reports all participating hsd's/opal's and the "supervisor" drp process (determined by the named-semaphore) could disable the unused ones
PvaDetector
- use "-vvv" to get printout of timestamp matching process
- options to executable: "-1" is fuzzy timestamping, "-0" is no timestamp matching, and no argument is precise timestamp matching.
- the IP where the PV is served might not be the same as the IP returned by a ping. For example: ping ctl-kfe-cam-02 returns 172.21.92.80, but the PV is served at 172.21.156.96
- netconfig can be used to determine the IP where the PV is served. For example:
/reg/common/tools/bin/netconfig search ctl-kfe-cam-02-drp
ctl-kfe-cam-02-drp:
subnet: daq-drp-neh.pcdsn
Ethernet Address: b4:2e:99:ab:14:4f
IP: 172.21.156.96
Contact: uid=velmir,ou=People,dc=reg,o=slac
PC Number: 00000
Location: Same as ctl-kfe-cam-02
Description: DRP interface for ctl-kfe-cam-02
Puppet Classes:Found 1 entries that match ctl-kfe-cam-02-drp.
Fake Camera
- use this to check state of the pgp link, and the readout group, size and link mask (instead of kcuStatus): kcuSim -s -d /dev/datadev_0
- use this to configure readout group, size, link mask: kcuSimValid -d /dev/datadev_0 -c 1 -C 2,320,0xf
- I think this hangs because it's trying to validate a number of events (specified with the -c argument?)
TEB/MEB
(conversation with Ric on 06/16/20 on TEB grafana page)
BypCt: number bypassing the TEB
BtWtg: boolean saying whether we're waiting to allocate a batch
TxPdg (MEB, TEB, DRP): boolean. libfabric saying try again to send to the designated destination (meb, teb, drp)
RxPdg (MEB, TEB, DRP): same as above but for Rx.
(T(eb)M(eb))CtbOInFlt: incremented on a send, decremented on a receive (hence "in flight")
In tables at the bottom: ToEvtCnt is number of events timed out by teb
WrtCnt MonCnt PsclCnt: the trigger decisions
TOEvtCnt TIEvtCnt: O is outbound from drp to teb, I is inbound from teb to drp
Look in teb log file for timeout messages. To get contributor id look for messages like this in drp:
/reg/neh/home/cpo/2020/06/16_18:19:24_drp-tst-dev010:tmohsd_0.log:Parameters of Contributor ID 8:
Conversation from Ric and Valerio on the opal file-writing problem (11/30/2020):
I was poking around with daqPipes just to familiarize myself with it and I was looking at the crash this morning at around 8.30. I noticed that at 8.25.00 the opal queue is at 100% nd teb0 is starting to give bad signs (again at ID0, from the bit mask) However, if I make steps of 1 second, I see that it seems to recover, with the queue occupancy dropping to 98, 73 then 0. However, a few seconds later the drp batch pool for all the hsd lists are blocked. I would like to ask you (answer when you have time, it is just for me to understand): is this the usual Opal problem that we see? Why does it seem to recover before the batch pool blocks? I see that the first batch pool to be exhausted is the opal one. Is this somehow related?
- I’ve still been trying to understand that one myself, but keep getting interrupted to work on something else, so here is my perhaps half baked thought: Whatever the issue is that blocks the Opal from writing, eventually goes away and so it can drain. The problem is that that is so late that the TEB has started timing out a (many?) partially built event(s). Events for which there is no contributor don’t produce a result for the missing contributor, so if that contributor (sorry, DRP) tried to produce a contribution, it never gets an answer, which is needed to release the input batch and PGP DMA buffer. Then when the system unblocks, a SlowUpdate (perhaps, could be an L1A, too, I think) comes along with a timestamp so far in the future that it wraps around the batch pool, a ring buffer. This blocks because there might already be an older contribution there that is waiting to be released. It scrambles my brain to think about, so apologies if it isn’t clear. I’m trying to think of a more robust way to do it, but haven’t gotten very far yet.
- One possibility might be for the contributor/DRP to time out the input buffer in EbReceiver, so that if a result matching that input never arrives, the input buffer and PGP buffer are released. This could produce some really complicated failure modes that are hard to debug, because the system wouldn’t stop. Chris discouraged me from going down that path for fear of making things more complicated, rightly so, I think.
If a contribution is missing, the *EBs time it out (4 seconds, IIRR), then mark the event with DroppedContribution damage. The Result dgram (TEB only, and it contains the trigger decision) receives this damage and is sent to all contributors that the TEB heard from for that event. Sending it to contributors it didn’t hear from might cause problems because they might have crashed. Thus, if there’s damage raised by the TEB, it appears in all contributions that the DRPs write to disk and send to the monitoring. This is the way you can tell in the TEB Performance grafana plots whether the DRP or the TEB is raising the damage.
Ok thank you. But when you say: "If that contributor (sorry, DRP) tried to produce a contribution, it never gets an answer, which is needed to release the input batch and PGP DMA buffer". I guess you mean that the DRP tries to collect a contribution for a contributor that maybe is not there. But why would the DRP try to do that? It should know about the damage from the TEB's trigger decision, right? (Do not feel compelled to answer immediately, when you have time)
The TEB continues to receive contributions even when there’s an incomplete event in its buffers. Thus, if an event or series of events is incomplete, but a subsequent event does show up as complete, all those earlier incomplete events are marked with DroppedContribution and flushed, with the assumption they will never complete. This happens before the timeout time expires. If the missing contributions then show up anyway (the assumption was wrong), they’re out of time order, and thus dropped on the floor (rather than starting a new event which will have the originally found contributors in it missing (Aaah, my fingers have form knots!), causing a split event (don’t know if that’s universal terminology)). A split event is often indicative of the timeout being too short.
- The problem is that the DRP’s Result thread, what we call EbReceiver, if that thread gets stuck, like in the Opal case, for long enough, it will backpressure into the TEB so that it hangs in trying to send some Result to the DRPs. (I think the half-bakedness of my idea is starting to show…) Meanwhile, the DRPs have continued to produce Input Dgrams and sent them to the TEB, until they ran out of batch buffer pool. That then backs up in the KCU to the point that the Deadtime signal is asserted. Given the different contribution sizes, some DRPs send more Inputs than others, I think. After long enough, the TEB’s timeout timer goes off, but because it’s paralyzed by being stuck in the Result send(), nothing happens (the TEB is single threaded) and the system comes to a halt. At long last, the Opal is released, which allows the TEB to complete sending its ancient Result, but then continues on to deal with all those timed out events. All those timed out events actually had Inputs which now start to flow, but because the Results for those events have already been sent to the contributors that produced their Inputs in time, the DRPs that produced their Inputs late never get to release their Input buffers.
A thought from Ric on how shmem buffer sizes are calculated:
- If the buffer for the Configure dgram (in /usr/lib/systemd/system/tdetsim.service) is specified to be larger, it wins. Otherwise it’s the Pebble buffer size. The Pebble buffer size is derived from the tdetsim.service cfgSize, unless it’s overridden by the pebbleBufSize kwarg to the drp executable
BOS
See Matt's information: Calient S320 ("The BOS")
XPM
NEH Topology
Diagrams from Matt Weaver. on July 15, 2021 XPM:0 is in the FEE, XPM:2 is in TMO, XPM:3 is in RIX, and XPM:4 is also in TMO (not certain about the last one).
Before May 2021:
https://docs.google.com/drawings/d/1IX8qFco1tY_HJFdK-UTUKaaP_ZYb3hr3EPJJQS65Ffk/edit?usp=sharing
Now (May 2021):
https://docs.google.com/drawings/d/1clqPlpWZiohWoOaAN9_qr4o06H0OlCHBqAirVo9CXxo/edit?usp=sharing
Eventually:
https://docs.google.com/drawings/d/1alpt4nDkSdIxZRQdHMLxyvG5HsCrc7kImiwGUYAPHSE/edit?usp=sharing
NEH Connections
(on Sept. 20, 2021). Some information about RIX FIM connections are below as well (don't show up here because of xpm link problems).


Numbering
amc1 on left, amc0 on right
ports count 0-6 from right to left, matching labelling on xpm, but opposite the order in xpmpva which goes left to right
LEFTMOST PORT IS UNUSED (labelled 7 on panel)
in fee, xpm0 was lowest slot (above switch), xpm1 one up
pyxpm 2 is fee (currently the master), 4 is hutch, 3 unused
epics numbering of xpm 0 2 1
Trigger Delays
- the total delay of a trigger consists of three pieces: CuDelay, L0Delay (per XPM and per readout group), and detector delays. Note that L0Delay is also called "PartitionDelay" in the rogue registers. L0Delay variable is: DAQ:NEH:XPM:0:PART:0:L0Delay (second zero is readout group). Note: L0Delay only matters for the master XPM.
- CuDelay is set in the supervisor XPM and affects all client XPMs (e.g. TMO, RIX). Matt tries to not adjust this since it is global.
- In the various detector specific configdb/*config.py the current value of L0Delay for the appropriate readout group is included in the "delay_ns" calculation. So if, for example, L0Delay is adjusted then the "delay_ns" set in the configuration database remains constant.
- Moving timing earlier can be harder, but can be done by reducing group L0Delay.
- In general, don't want to reduce L0Delay too much because that means the "trigger decision" (send L1accept or not, depending on "full") must be made earlier, which increases the buffering requirements. This doesn't matter at 120Hz, but matters for MHz running.
- the per-readout-group L0Delay settings (and CuDelay) are stored under a special tmo/XPM alias in the configdb and are read when the pyxpm processes are restarted:
(ps-4.3.2) psbuild-rhel7-01:lcls2$ configdb ls tmo/XPM
DAQ:NEH:XPM:0
DAQ:NEH:XPM:2
DAQ:NEH:XPM:3
Resetting
To see the names of the shelf managers use this command:
(ps-4.3.2) tmo-daq:scripts> /reg/common/tools/bin/netconfig search shm\* | grep shm
shm-tst-lab2-atca02:
shm-tst-hp01:
shm-tmo-daq01:
shm-neh-daq01:
shm-rix-daq01:
shm-daq-drp01:
shm-las-vme-testcrate:
Found 7 entries that match shm*.
(ps-4.3.2) tmo-daq:scripts>
"rix" and "tmo" ones are in the hutches. "daq" one is currently in the FEE and the "neh" one is in room 208 of bldg 950.
The timing system should come back up. If not, use a machine with afs (psdev, pslab03?)
- source /afs/slac/g/reseng/IPMC/env.csh
- fru_deactivate shm-tst-lab2-atca01
- fru_deactivate shm-tst-lab2-atca02
- fru_deactivate shm-tst-lab2-atca03
- fru_activate shm-tst-lab2-atca01
- fru_activate shm-tst-lab2-atca02
- fru_activate shm-tst-lab2-atca03
At NEH:
- rix-
Matt says for the NEH system: For slot 2 (this is XPM:0, according to Matt),
source /afs/slac/g/reseng/IPMC/env.sh
fru_deactivate shm-daq-drp01/2
fru_activate shm-daq-drp01/2
This produces an error which can be ignored, according to Matt:
fru_deactivate shm-daq-drp01/2
ATCA_deactivate: ERROR: CBA_ipmb_cmd failed: rc = 0x9e, 0x10
ERROR - Couldn't connect to IPMC shm-daq-drp01/2
(later: we now think this should work For TMO since "amcc_dump_bsi --all shm-tmo-daq01" seems to work. (old: This doesn't work for the new crate in TMO (don't know why yet), so we have to do):
ssh root@shm-tmo-daq01
clia deactivate board 2
clia activate board 2
This crate has 2 xpm's at the moment (boards 2 and 3). Can see this with "clia fruinfo board 2".
Then have to restart the base processes so that the timing system can reload it's default constants from the database (e.g. msgdelays which protect the buffering)
This error message ("Establishing link...") means that the initial ethernet communication between the ATCA board the pyxpm software is not establishing a connection. That either means the network is down for some reason, or the board is already connected to another instance of pyxpm somewhere.
'amcc_dump_bsi --all shm-tst-lab2-atca02/2' (from psdev) will tell you if the slot 2 xpm (XPM:2) ethernet link is up.
Fiber Optic Powers
Can check light levels going into the xpm by looking at EPICS variables like this:
(ps-4.1.2) tmo-daq:scripts> pvget DAQ:NEH:XPM:0:SFPSTATUS
DAQ:NEH:XPM:0:SFPSTATUS 2021-01-13 14:36:15.450
LossOfSignal ModuleAbsent TxPower RxPower
           0            0  6.5535  6.5535
           1            0  0.5701  0.0001
           0            0  0.5883  0.7572
           0            0  0.5746  0.5679
           0            0  0.8134   0.738
           0            0  0.6844    0.88
           0            0  0.5942  0.4925
           0            0  0.5218  0.7779
           1            0   0.608  0.0001
           0            0  0.5419  0.3033
           1            0  0.6652  0.0001
           0            0  0.5177  0.8751
           1            1       0       0
           0            0  0.7723   0.201
XPM Timing Links Not Locking
If XPM links don't lock, here are some past causes:
- check that transceivers (especially QSFP, which can be difficult) are fully plugged in.
- for opal detectors:
- use devGui to toggle between LCLS1/LCLS2 timing (Matt has added this to the opal config script, but to the part that executes at startup time)
- hit TxPhyReset in the devGui (this should now be done in the opal drp executable)
- for timing system detectors: run "kcuSim -s -d /dev/datadev_1", this should also be done when one runs a drp process on the drp node (to initialize the timing registers). the drp executable in this case doesn't need any transitions.
- hit Tx/Rx reset on xpmpva gui (AMC tabs).
- Valerio and Matt had noticed that the BOS sometimes lets its connections deteriorate. To fix:
- ssh root@osw-daq-calients320
- omm-ctrl --reset
Switching Between Internal/External Timing
Do this if accelerator timing is gone. Can see the timestamp is "wonky" to quote Dr. Matthew Weaver.
Only have to do this for the master xpm that is receiving the accelerator timing. Run "pyxpm --ip 10.0.1.102 -I -P DAQ:NEH:XPM:0" (i.e. remove the database flags). The "-I" flag does some initialization, in particular the CuInput flag is set to 1 (for internal timing) instead of 0 (external timing):
This file puts xpm-0 in internal timing mode: https://github.com/slac-lcls/lcls2/blob/master/psdaq/psdaq/cnf/internal-neh-base.cnf. Note that in internal timing mode the L0Delay (per-readout-group) seems to default to 90. Fix it with pvput DAQ:NEH:XPM:0:PART:0:L0Delay 80".
One should switch back to external mode by setting CuInput to 0 in xpmpva CuTiming tab. Still want to switch to external-timing cnf file after this is done. Check that the FiducialErr box is not checked (try ClearErr to see if it fixes). If this doesn't clear it can be a sign that ACR has put it "wrong divisor" on their end.
For now (09/20/21) this procedure should also be used to start the system in external timing mode. To summarize, from Matt:
- Tried procmgr start internal-neh-base.cnf but found errors
- fru_deactivate/activate
- procmgr start internal-neh-base.cnf worked
- changed CuInput 0 -> 1 in xpmpva
- procmgr stopall internal-neh-base.cnf
- procmgr start neh-base.cnf
Opal
NOTE: when setting up an opal, the LCLS2 timing comes in on lane 1 (counting from zero) on the second QSFP, as described here: https://github.com/slaclab/cameralink-gateway.
NOTE: when powering on the opal/feb-box (front-end-board) the LED on the FEB box will stay red until the DAQ has configured it, when it will turn green. Also, only after the DAQ configuration is done will the "@ID?" and "@BS?" uart strings sent to the camera here work. This is probably also fixable by loading a rogue yaml config file included in the cameralink-gateway git repo:
(ps-4.1.0) drp-neh-cmp011:~$ python ~/git/cameralink-gateway/software/scripts/devGui.py --camType Opal1000 --enLclsI False --enLclsII True --startupMode True
Rogue/pyrogue version v5.4.0. https://github.com/slaclab/rogue
sendString: @ID?
sendString: @BS?
start: Started zmqServer on port 9101
Got ACK Response
recvString: @"OPAL-1000m/CL S/N:254067
Got ACK Response
recvString: @"1.20;2.31;2.52
Larry's instructions are here:
https://github.com/slaclab/cameralink-gateway#example-of-starting-up-opal1000
running standalone rogue gui (NOTE: remove --enVcMask 0 if you want to talk to the FEB):
python scripts/devGui --pgp4 0 --laneConfig 0=Opal1000 --pcieBoardType Kcu1500 --enLclsII 1 --enableConfig 0 --startupMode 1 --enVcMask 0
OLD: python ~/git/cameralink-gateway/software/scripts/devGui.py --camType Opal1000 --enLclsI False --enLclsII True --startupMode True
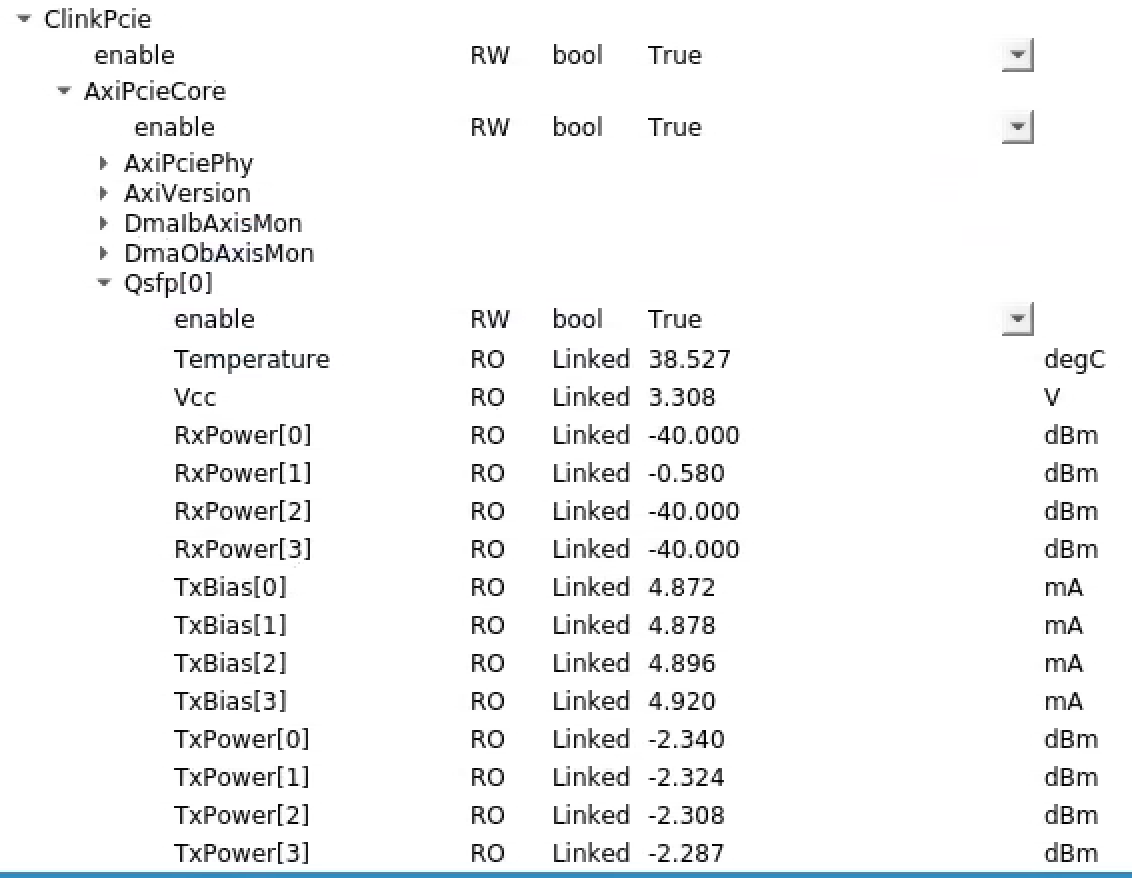
NOTE: it can be very useful to check ClinkPcie.AxiPcieCore.AxiVersion (kcu1500) and ClinkFeb[0].AxiVersion (cameralink converter box) to see if the kcu can talk to the front-end-board (FEB).
programming KCU:
python software/scripts/updatePcieFpga.py --path /reg/neh/home/cpo/junk/ --type SPIx8
warnings reprogramming FEB fpga:
(note it looks like we use the "1ch" firmware for opal since it's base camlink?)
(rogue_pre-release) [cpo@lcls-pc83236 software]$ python software/scripts/updateFebFpga.py --mcs ~/ClinkFebPgp2b_1ch-0x02000000-20191210103130-ruckman-d6618cc.mcs --lane 0
https://github.com/slaclab/rogue
Debugging Phase 1 Not Going Through
See the notes on this page: Two Phase Transitions
Debugging Configure Phase 2 Not Going Through
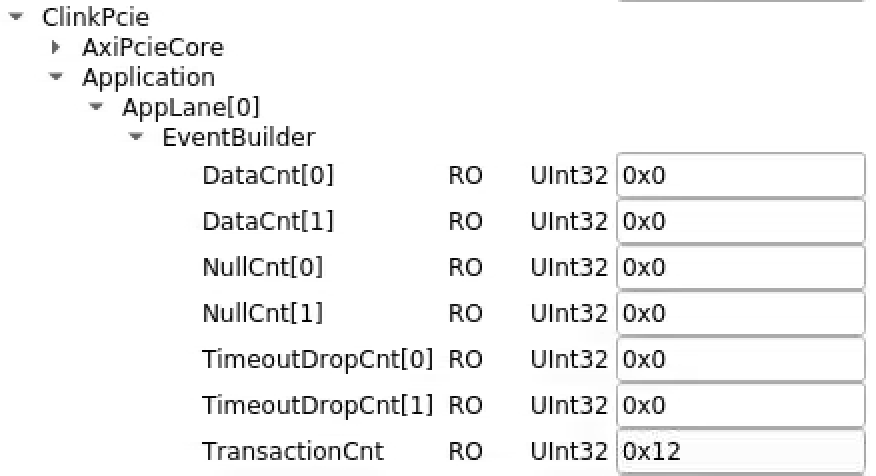
In groupca window "transitions" tab send configure transitions. In rogue devGui see ClinkPcie->Application->AppLane[0]->EventBuilder→TransactionCnt increase with each one.
After turning off ClinkDevRoot→PollEn in devGui, sending two configure transitions can see the following change in "cat /proc/datadev_0" (output of "diff"):
<         Hw Dma Wr Index : 3560
<         Sw Dma Wr Index : 3560
---
>         Hw Dma Wr Index : 3562
>         Sw Dma Wr Index : 3562
43c43
<        Tot Buffer Use : 105960
---
>        Tot Buffer Use : 105962
Run pgpread and send transitions with groupca. For configure transitions should see something like this:
(ps-4.5.0) drp-tst-dev004:lcls2$ psdaq/build/drp/pgpread -d /dev/datadev_0 -c 1 -r
device  /dev/datadev_0
dmaCount 1028  dmaSize 16384
EventBatcherHeader: vers 1 seq 14 width 2 sfsize 32
Size 48 B | Dest 0 | Transition id 2 | pulse id 9026296791400 | event counter 16 | index 143
env 02200010
EventBatcherHeader: vers 1 seq 15 width 2 sfsize 32
Size 48 B | Dest 0 | Transition id 2 | pulse id 9026298152624 | event counter 17 | index 144
env 02220010
Debugging 100% Deadtime with Larry and Ben
https://github.com/slaclab/cameralink-gateway#pgp-channel-mapping
Look in Hsio->PgpRxAxisMon[0]->Ch[1]->FrameCnt to see frames from FEB.
Ch[0] is register for FEB
Ch[2] is the UART
ClinkPcie->Application->AppLane[0]->EventBuilder->DataCnt[0] increments with EITHER a trigger message or a transition message
DataCnt[1] increments when we have camera data. Should be equivalent to the PGP FrameCnt above
Above only increment after the event-builder has done its job
Setting Bypass to 1 turns off the event builder (bit mask, per-lane):
bit 0 to 1 bypasses timing
bit 1 to 1 bypasses the camera
tdest lane mapping:
https://github.com/slaclab/cameralink-gateway/blob/master/firmware/common/rtl/AppLane.vhd#L109-L111
Tried hitting
Commands->ClinkDevRoot->ClinkPcie->Application->Applane[0]->Eventbuilder->CntRst
didn't help
NOTE: to see the XpmPause register below it is important to startup devGui as shown above (so the right XPM registers get enabled).
When we get struck
TriggerEventBuffer[0]=>FifoPause goes True
TriggerEventBuffer[0]=>XpmPause goes True
setting EventBuilder->Blowoff True resets
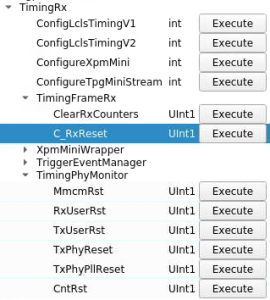
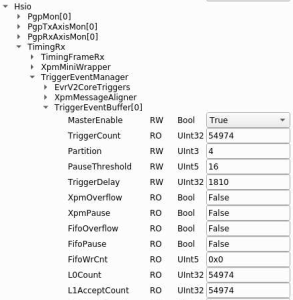
Using groupca to send a transition causes these under Hsio->TimingRx->TriggerEventManager:
TriggerEventBuffer[0]=>TransitionCount to increment, and
TriggerEventBuffer[0]=>FifoWrCount to increment
XpmOverflow=True is latched version of FifoOverflow. Need ClearReadout to reset.
Check that TrigerEventBuffer[0]->Partition is set to right readout group
Try toggling between XpmMini and LCLS2 timing: I think this fixed the kcu1500→XPM link not locking one time.
Check TimingRx->RimingFrameRx->RxLinkUp is 0x1 (link to XPM)
Check Hsio->PgpMon[0]→RemLinkReady=True (link to FEB, I think)
Check ClinkTop→LinkLockedA=True (link to opal)
Check ClkInFreq and ClinkClkFreq are 80Mhz (camlink frequencies)
ClinkTop->Ch[0]:
LinkMode Base
DataMode 12Bit
FrameMode Frame
TapCount 0x2
DataEn True
BaudRate 57600
FrameCount increments with L1Accepts, but not if deadtime.
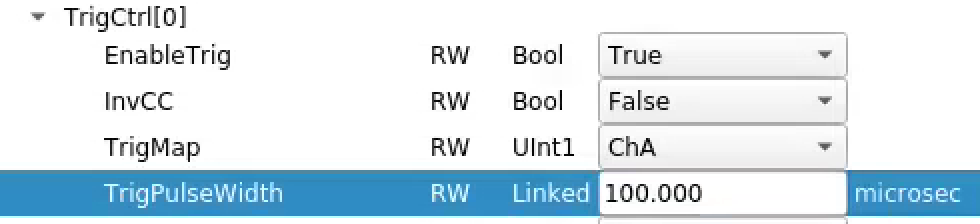
ClinkTop→TrigCtrl[0]:
TrigCnt counts, but not if dead time.
Tried hitting all the resets on the rogue GUI's "commands" tab (CntRst, TimerRst, HardRst, SoftRst) but didn't help with 100% deadtime. Powercycling the KCU1500 node. After that the XPM link wouldn't lock at all. Was able to get it to re-lock by hitting the resets here ... wasn't watching the right column on xpmpva, so I don't know which one did the trick (but a second power-cycle later on suggests tat it was the TxPhyReset):
Run pgpread like this (-c 1 says to use virtual-channel 1, for camera images, I think, and -r tells it to use rogue mode since it's getting an EventBatcherHeader not a TimingSystemHeader):
psdaq/build/drp/pgpread -d /dev/datadev_0 -c 1 -r
REMEMBER: can run DAQ (or at least pgpread) and rogue GUI at the same time since rogue disables opening data stream virtual channel with this line: https://github.com/slaclab/lcls2-pgp-fw-lib/blob/d57de0f1da359b3f1ab8d899968c022f92b58a28/python/lcls2_pgp_fw_lib/hardware/shared/_Root.py#L22. LATER: the drp couldn't seem to open /dev/datadev_0 VC 0 with this error when rogue GUI was running, but maybe the data (VC 1?) is OK:
rogue.GeneralError: AxiStreamDma::AxiStreamDma: General Error: Failed to open device file /dev/datadev_0 with dest 0x0! Another process may already have it open!
See 1Hz of SlowUpdates going through (transition id 10). The SlowUpdates cause TransactionCnt to increment at 1Hz (zero'd by toggling blowoff):
Disabled slow updates, but didn't help with 100% dead time. Do blowoff (to empty queues) and clear readout (to clear latched XpmOverflow which in turn latches deadtime?). Then pgpread sees transitions and some l1accepts (although haltingly?) before deadtime kicks in.
Tried the FifoReset here in addition to blowoff and clearreadout but don't see any l1accepts in pgpread:
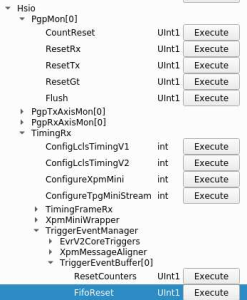
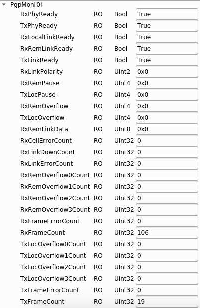
Do see these registers counting (RxFrameCount, TxFrameCount). Perhaps the rogue register reads?
Tried this UserRst with blowoff/clearreadout, but doesn't help:
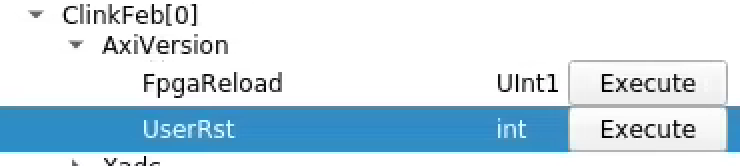
Also tried FpgaReload above and running the DAQ (including configure, since presumably the FEB lost its configuration) but still 100% deadtime.
Tried power cycling camera. Camlink converter box LED was GREEN after power cycling, but still 100% deadtime.
Power cycled the camlink converter box. LED was RED after power cycling. Failed to configure. Power cycling the camera. Camlink converter box LED stayed RED. After configuring went to GREEN. Makes it feel like there might be a power-ordering issue: after cycling camlink converter box need to cycle the camera and reconfigure. Still get deadtime. Checked camlink cables: screws needed tightening, but felt ok.
Now can't even get a transition through.
Measure light levels:
- camlink converter to kcu (1310nm): -5.2dBm at box, -4.7dBm at KCU
- XPM to kcu (850nm): -8.2dBm at XPM, can't measure at KCU because of quad fiber
Powercycled cmp011 again. After resetting the XPM link (toggled XpmMiniTiming/ConfigLCLS2Timing and hit TxPhyReset) I can configure. Back in the mode where we get 100% deadtime, but I can get transitions and a few events through by doing Blowoff/ClearReadout.
Tried increasing the TriggerPulseWidth to 100us (was 0.092us?) but doesn't help with deadtime:
This TxOpCodeCount under Hsio→PgpMon[0] seems to only increase with L1Accepts. We are getting far fewer of these than the L1Accept rate says we should. Suggests we're dropping camera frames?

Possible breakthrough: if I power cycle the camera and run without reconfiguring then L1Accepts show up in pgpreader at the correct rate. Feels like our configuration is breaking the camera? Compared the power-on defaults (https://www.slac.stanford.edu/exp/npa/manuals/opal1000man.pdf) to our config. Don't see an obvious difference in UART settings except we have VR=1 (vertical remap) and OVL=1 (overlay frame counter and integration time on early pixel data)?. Other differences (BL(black level), DPE (defect pixel correction) OFS (output offset)) feel like they don't matter. Tried setting VR=0 and OVL=0 but it didn't help. Set them back to 1.
Horrible workaround: if I configure the camera, then powercycle, it appears to run.
The XPM link went bad again, and recovered with TxPhyReset.
Ben pointed out that in the case of failure, these L0Count/L1AcceptCount counters increment at the right rate, but TxOpCodeCount doesn't, so not all L1's are getting translated into TxOpCode's (!), so it's a problem in the KCU. Appears to contradict the camera-powercycle approach above, but perhaps that is caused by the exposure time getting set smaller so it can handle messed up delays? (see L0Delay solution below):
Questions for Larry/Ben:
- does clearreadout trigger blowoff and fiforeset? (and reset the latched xpmoverflow)
- why would TxPhyReset help the xpm link?
- is TxOpCodeCount the right thing to watch?
- why doesn't send string work for the opal? Answer from Larry: need to prepend an "@", e.g. "@SN?" seems to work.
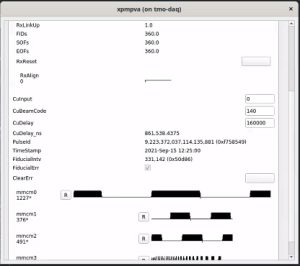
Try moving back to old timing values. Current settings:
(ps-3.1.16) tmo-daq:lcls2$ pvget DAQ:NEH:XPM:0:XTPG:CuDelay
DAQ:NEH:XPM:0:XTPG:CuDelay 2020-10-21 09:33:26.010  134682
(ps-3.1.16) tmo-daq:lcls2$ pvget DAQ:NEH:XPM:0:PART:4:L0Delay
DAQ:NEH:XPM:0:PART:4:L0Delay 2020-10-21 09:33:26.334  10
Matt writes that the pre-Oct.-15 values were:
These were the values prior to 10/15
pvput DAQ:NEH:XPM:0:PART:3:L0Delay 90 (readout group 3)
pvput DAQ:NEH:XPM:0:XTPG:CuDelay 160000
Changes after that are in the tmoc00118 logbook.
This appeared to fix the problem!:
(ps-3.1.16) tmo-daq:lcls2$ pvput DAQ:NEH:XPM:0:PART:4:L0Delay 90
Old : 2020-10-21 09:33:26.334  10
New : 2020-10-21 12:48:30.590  90
(ps-3.1.16) tmo-daq:lcls2$ pvput DAQ:NEH:XPM:0:XTPG:CuDelay 160000
Old : 2020-10-21 09:33:26.010  134682
New : 2020-10-21 12:48:58.977  160000
It turns out the CuTiming didn't mater, only the L0Delay change fixed it. From the opal log file:
I guess this is output from the logfile when it fails:  triggerDelay 17810
And when it succeeds: triggerDelay 1810 (after changing L0Delay to 90)
Made it feel like we're running out of bits in firmware for triggerDelay, but (a) rogue reads back the register correctly (b) Matt says he thinks we have 32-bits.
Addendum on May 18, 2021: Matt found a bug in the Ben's trigger module (in cameralink gateway firmware, hsd, epix, kcu). There is a delay 32-deep fifo where triggers go, and firmware was queueing every MHz slot and filling it up. We couldn't set a large "user delay" (e.g. hsd "raw_start").
Note by Valerio (9/7/21): Lane 01 (Marked as "2" on the breakout cable) seem not to work on cmp011. As a workaround, Lane 02 (marked as 3 on the cable) has been used
JTAG Programming the FEB Camlink Converter
Use configuration memory part number s25fl128sxxxxxx0-spi-x1_x2-x4 in Vivado.
An example old mcs file: ClinkFebPgp2b_1ch-0x00000025-20190315182526-ruckman-af9cde50.mcs
Fiber Optic Powers
NOTE: Reading of fiber-optic powers is off by default: need to set "enable" to True (both on KCU and FEB) and the click the "Read All" registers button at the bottom of the GUI. To see the KCU side one has to tell devGui what the board type is:
python scripts/devGui --pgp4 1 --laneConfig 1=Opal1000 --pcieBoardType Kcu1500
Note that reading the optical powers on the KCU is slow (16 seconds?). Larry has a plan to improve that speed. It's faster on the FEB.
Running ATM Opal
Who manages the server for the feedback epics variable? It's a notepad-pv server that is managed by Silke/POCs.
Why does det.raw.image not work when we enable fex? Need to set fex→prescale = 1 to get image on every shot, 0 to disable images. det.raw.image() should still work, but doesn't. Need to debug. det.ttfex.image() might be an ROI for the background events (no beam). det.ttfex.proj_ref() is a projection of that ROI. det.ttfex.proj_sig() for every event beam. Not sure what det.ttfex.raw() is.
Restarting IOCs
(courtesy of Tyler Johnson)
First would be to look at the rix iocmanager config file which should be in a directory like /cds/group/pcds/pyps/apps/config/rix/iocmanager.cfg.
In that file there will be a line listing the wave8 ioc, the host it's running on, and a port. You can telnet to that host at that port to get to the ioc shell. From there you can ctl+x to kill the ioc. If it doesn't reboot automatically on its own, you can restart it with ctl+r.
Tyler also uses this command to find IOC's: grep <string_related_to_ioc> /reg/g/pcds/pyps/config/*/iocmanager.cfg
An example of <string_related_to_ioc> would be "fim" for various sims.
FIM/Wave8
The RIX controls machine that talks to the FIMs is ctl-rix-fim-01.
The new kcu firmware from https://github.com/slaclab/pgp-pcie-apps should be used, although rogue software lives in https://github.com/slaclab/wave8.
Running 8 FIMs on the same cmp node requires at least the KCu firmware that comes with version v1.5.0 of pgp-pcie-apps
Updating the firmware is very similar to the Opal case:
cd pgp-pcie-apps
python scripts/updatePcieFpga.py --path <PATH TO FIRMWARE DIR>
The firmware can be downloaded off GitHub for every release
Path to the IOC panel startup files:
- TMO: /reg/g/pcds/epics-dev/bhill/epics/ioc/common/pgpWave8/pgpWave8-git
Run the rogue gui's from the wave8/software directory like this:
- python scripts/wave8DAQ.py --start_viewer 1 --l 2 (for the front-end board)
- python scripts/PcieDebugGui.py --boardType Kcu1500 (need the flag at the end to get qsfp optical powers)
Start the 3 RIX ioc's like this (this example is for number 3). Read the .cmd file to see the epics prefix for fim's 1,2,3:
- /reg/g/pcds/epics-dev/bhill/epics/ioc/common/pgpWave8/pgpWave8-git/children/build/iocBoot/ioc-rix-pgpw8-03/edm-ioc-rix-pgpw8-03.cmd
(from Bruce) RIX FIM Top launcher which gives access to HV and wave8 lanes 0 and 1 is:
- /reg/g/pcds/epics-dev/bhill/epics/ioc/common/pgpWave8/pgpWave8-git/edm-rix-fim-01-top.cmd
I think on can check that IOC's are up with commands like this (see rix.cnf for EPICS prefixes):
- caget MR4K2:FIM:W8:02:Top:TriggerEventManager:TriggerEventBuffer[0]:Partition
Lane Assignments and Fiber Connections
NOTE (June 2, 2021): we think we have a bad qsfp on cmp007 fiber 1 (counting from 1, so lane 0). Problem remained after swapping breakout fibers.
NOTE (July 15, 2021): currently the timing link from FIM to XPM (deadtime feedback) does not function. Matt is working on it.
TMO: Counting from zero: 1,2 (0 is bad, see above)
RIX: cmp007 PGP lanes counting from zero: 4 (chemrix), 5 (KB: mr4k2), 6 (KB: mr3k2),. Data Patch panel: in RIX rack01 the order of patch fibers in the top left corner of the cassette is (left to right): m4k2, mr3k2, chemrix. XPM:3 Timing: AMC0 (right most one) ports 2,3,4 (counting right to left, starting from 0): mr4k2, mr3k2, chemrix.
Link-locked LEDs
lower-right: EVR0 (controls)
lower-left: EVR1 (daq)
upper-right: PGP0 (controls)
upper-left: PGP1 (daq)
Jumping L1Count
cpo saw this error showing up in rix fim1 (MR4K2) on 10/16/21:
rix-drp[27981]: <C> PGPReader: Jump in complete l1Count 225 -> 227 | difference 2, tid L1Accept
By swapping fibers I determined the problem was on the FIM side (not DAQ/DRP node) or in the fiber transport to the DAQ (receiving power measured -10dBm at the DRP). In the end power cycling fim1 seemed to solve the problem.
Crashes
If you see this crash at startup it is an indication that the fim IOC that writes these registers is not up and running:
rix-drp[225759]: <C> XPM Remote link id register illegal value: 0xffffffff. Try XPM TxLink reset.
JTAG programming
To program fim firmware via JTAG use a machine like pslab04, setup Vivado with:
source /afs/slac/g/reseng/xilinx/2020.2/Vivado/2020.2/settings64.sh
The startup Vivado with the command "vivado". Select the "hardware manager".
When right-clicking on the Xilinx device in the hardware manager, for "configuration memory device" select mt25ql256-spi-x1_x2_x4 as shown here on slide 7 from Larry:
https://docs.google.com/presentation/d/1e6CD5VV5nUxqJFbEky0XWcoWPtA20_VZGqTkRjJDnDk/edit#slide=id.p4
RIX Mono Encoder
See Chris Ford's page here: UDP Encoder Interface (rix Mono Encoder)
Zach's PLC is at address 192.168.0.3 on cmp015.
In particular, the "loopback mode" described there and the netcat command can be useful for debugging whether the problem is on the DAQ end or on the controls PLC end.
JTAG
From Matt:
We can also use servers with JTAG/USB in the hutch to run a remote hw_server process for connecting to the vivado tools. I've used this on rix-daq-hsd-01, for instance. You need to run /reg/common/package/xilinx/Vivado_2018.3/HWSRVR/2018.3/bin/hw_server on that node (or any other with USB and access to that directory), run vivado on an AFS machine like pslab04, and start an ssh tunnel from pslab04 to the remote server for port 3121.
This might also work on machine psbuild-rhel7 in bldg 950 room 208, since it has access to vivado via afs?
shmem and monReqServer
- When increasing the number of monReqServer queues (with the -q option) it is necessary to increase the number of buffers (with the -n option, defaults to 8) because this line shares the total number of buffers among all the queues: https://github.com/slac-lcls/lcls2/blob/5301f172c23b448dc8904f7eee20e508b4adc2e9/psalg/psalg/shmem/XtcMonitorServer.cc#L594. So far we have been using twice the number of buffers as queues (i.e. 2 buffers per queue)
Some of the various "plumbing" message queues (that the users don't see) create queues with the full number of buffers (set with the -n option). This can easily exceed the default linux system limit (currently 10) set in /proc/sys/fs/mqueue/msg_max. This can create an mq_open error because the mq_maxmsg value of the mq_attr struct is too large. The system limit needs to be set appropriately. An example of the error:
mq_open output: Invalid argument
name: '/PdsToMonitorEvQueue_tmo_6'
mq_attr:
        mq_flags 0x800
        mq_maxmsg 0xc
        mq_msgsize 0x10
        mq_curmsgs 0x0
epicsArch
epicsArch can segfault on configure if the number of variables gets large because the configure transition can exceed the dgram transition buffer size (see: https://github.com/slac-lcls/lcls2/blob/18401ef85dda5f7027e9321119a82410a00bad1e/psdaq/epicsArch/epicsArch.cc#L609). There are checks done afterwords, but the segfault can happen earlier than the checks. The transition buffer size can be specified on the epicsArch command line with the "-T" option (currently 1MB).
Right answer might be to have a "safe" Xtc::alloc method that would prevent the dgram from going past the end of the buffer, but that's a significant change.
Hutch Python
Logfiles can be found, for example, in /cds/group/pcds/pyps/apps/hutch-python/rix/logs
Power/Timing Outage Recovery Issues
- different modes for powercycling xpm's: (fru_deactivate commands, clia, nothing for xpm:3)
- solution for xpm:3 is to have IT install ethernet connection to shelf manager
- needed because xpm register bus would sometimes lockup
- hsd test-pattern mode
- solution is to restart the long-lived hsd ioc process, possibly more than once.
- TMO: hsd.cnf RIX: rix-hsd.cnf
- hsd configure phase2 failing
- xpm tx link resets necessary
- zombie hsd's creating deadtime
- difficulties switching between internal/external timing
- powercycle order for at least one rix andor usb/optical converters (intermittent)
- camlink converter box doesn't always work (power-cycle it last?)
- acr-side sxr xtcav doesn't come back
- lustre mount difficulties
- no ipmi on psmetric nodes (solution: these will be decommissioned)
Overview
Content Tools