PingER non VM Measurement agent
To World (excluding SLAC targets).
| Tick | min | 25th% | avg | median | 75th% | 90th% | 95th% | max | iqr | std dev | # pairs |
|---|---|---|---|---|---|---|---|---|---|---|---|
| Mar2015 | 23.312 | 178.346 | 239.329 | 211.152 | 293.499 | 339.425 | 379.947 | 780.659 | 115.153 | 104.510 | 107 |
| Feb2015 | 22.689 | 176.167 | 241.608 | 212.435 | 295.448 | 326.637 | 362.350 | 803.815 | 119.281 | 110.212 | 112 |
NB. February data is incomplete for the VM, so leave out
To Europe
| Tick | min | 25th% | avg | median | 75th% | 90th% | 95th% | max | iqr | std dev | # pairs |
|---|---|---|---|---|---|---|---|---|---|---|---|
| Mar2015 | 150.996 | 162.944 | 175.858 | 173.632 | 186.939 | 201.843 | 204.698 | 204.698 | 23.995 | 17.131 | 14 |
To N. America
| Tick | min | 25th% | avg | median | 75th% | 90th% | 95th% | max | iqr | std dev | # pairs |
|---|---|---|---|---|---|---|---|---|---|---|---|
| Mar2015 | 23.312 | . | 54.890 | 62.042 | 79.315 | 79.315 | 79.315 | 79.315 | . | 28.678 | 3 |
To non VM Pinger MA
PingER VM measurement agent
To Europe (excluding SLAC targets).
| Tick | min | 25th% | avg | median | 75th% | 90th% | 95th% | max | iqr | std dev | # pairs |
|---|---|---|---|---|---|---|---|---|---|---|---|
| Mar2015 | 23.698 | 176.221 | 238.352 | 213.278 | 294.279 | 340.938 | 381.412 | 796.140 | 118.058 | 109.834 | 107 |
| Feb2015 | 22.515 | 178.790 | 239.368 | 210.327 | 301.033 | 329.510 | 369.066 | 807.798 | 122.243 | 110.401 | 110 |
To Europe
| Tick | min | 25th% | avg | median | 75th% | 90th% | 95th% | max | iqr | std dev | # pairs |
|---|---|---|---|---|---|---|---|---|---|---|---|
| Mar2015 | 151.017 | 162.965 | 176.121 | 173.904 | 185.921 | 199.620 | 208.584 | 208.584 | 22.956 | 17.586 | 14 |
To N. America
| Tick | min | 25th% | avg | median | 75th% | 90th% | 95th% | max | iqr | std dev | # pairs |
|---|---|---|---|---|---|---|---|---|---|---|---|
| Mar2015 | 23.095 | 23.095 | 41.357 | 42.888 | 62.077 | 79.350 | 79.350 | 79.350 | 61.775 | 35.917 | 4 |
Correlation plots of pinger vs pingervm on for hourly
Below are correlation plots of hourly PingER measurements between pinger.slac.stanford.edu and pingervm.slac.stanford.edu between Feb 26 and March 3rd, 2015.
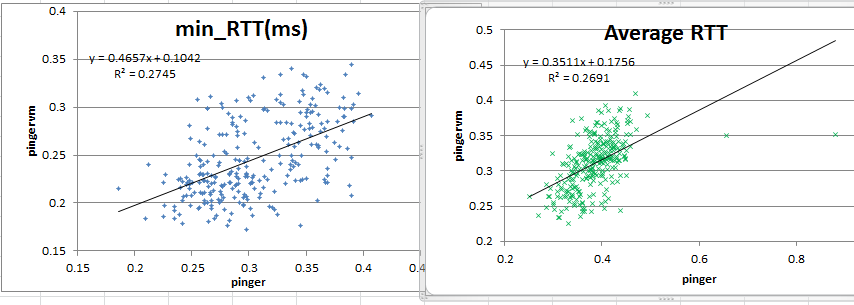
If one compares the average and median statistics for the tow sets of data, one gets the tables below:
| pinger>pingervm | min_RTT(ms) | avg_RTT(ms) | max_RTT(ms) |
| Average | 0.304368 | 0.385107 | 0.50461 |
| standard deviation | 0.045313 | 0.054924 | 0.272844 |
| median | 0.297 | 0.385 | 0.471 |
| IqR | 0.07625 | 0.0635 | 0.08075 |
| Count | 272 | 272 | 272 |
| pingervm>pinger | min_RTT(ms) | avg_RTT(ms) | max_RTT(ms) |
| Average | 0.245923 | 0.310827 | 0.392096 |
| stdev | 0.040275 | 0.03718 | 0.052863 |
| Median | 0.237 | 0.315 | 0.386 |
| IQR | 0.06425 | 0.04925 | 0.077 |
| Count | 272 | 272 | 272 |
And plots of the time series appears as below (spreadsheet)?
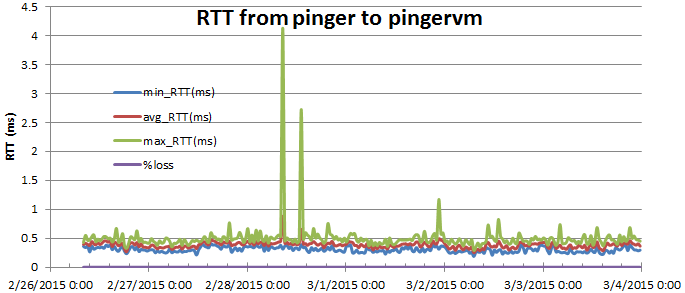
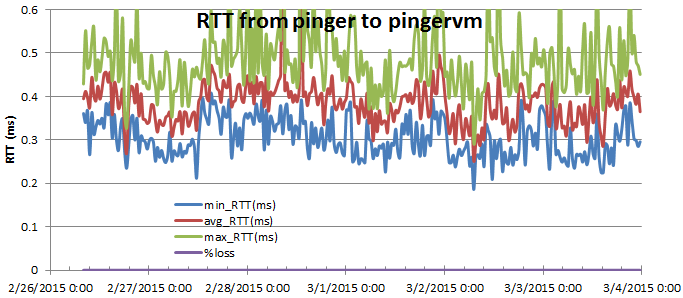
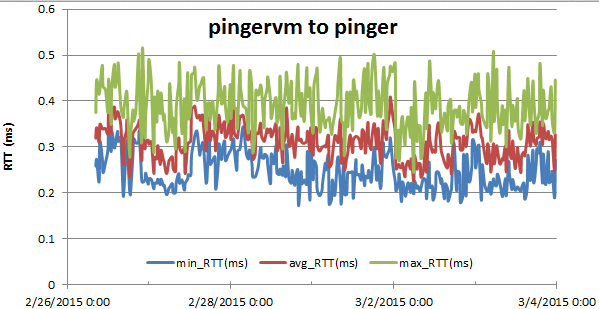
Looking at the above manually scaled plots of pinger>pingervm and pingervm>pinger together with the average, standard deviation, median and IQR tables and the differences between pinger as the monitoring site and pingervm as the monitoring site, we see:
| Diff (pinger-pingervm) | min_RTT(ms) | avg_RTT(ms) | max_RTT(ms) |
| Average | 0.058445 | 0.074279 | 0.112515 |
| stdev | 0.005037 | 0.017744 | 0.21998 |
| median | 0.06 | 0.07 | 0.085 |
| IqR | 0.012 | 0.01425 | 0.00375 |