Introduction
Johari at UNIMAS has installed two monitoring hosts: pinger.unimas.my and pinger2.unimas.my. See here for specs of two hosts.
Joahri can you add a table or something describing the hosts (OS, CPU etc.) and where they are located (at border, internally behind n routers etc.)
They are both entered as Monitors in the PingER meta database (NODEDETAILS)
Measurements
We gathered the RTT measurements for 100 byte pings from each of the two monitoring hosts to the same 116 remote hosts worldwide for September 25-27, 2013 They were imported into a spreadsheet and histograms of the RTT frequencies were created. At first glimpse there does not appear to be any substantive difference in the histograms for the two monitors. See below:
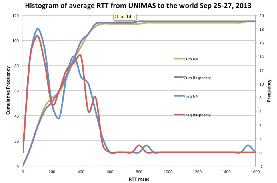
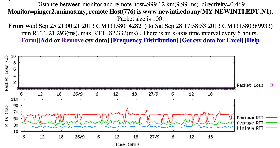
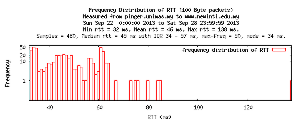
If there is a difference in the measurements made by the two hosts (e.g. due to their position on the network, how busy the host is, or the power of the host), it may be small. Thus it may be more apparent for measurements to a remote host that has a low value of RTT in general. We thus chose to look in more detail at the measurements from UNIMAS to www.newinti.edu.my(AKA MY.NEWINTI.EDU.N1) that had the lowest vaues of RTT seen from UNIMAS.
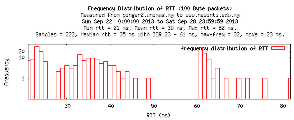
Time in msec. | Minimum RTT | Maximum RTT | Median RTT | IQR | Max frequency | Mode |
|---|---|---|---|---|---|---|
pinger (N4) | 21 | 82 | 45 | 24-57 | 50 | 34 |
pinger2 (RASPBERRY) | 32 | 165 | 35 | 23-61 | 32 | 23 |
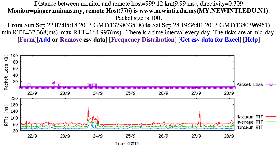
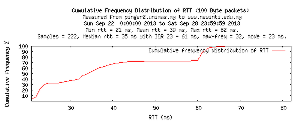
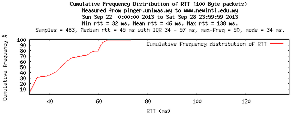
The time series and distributions are shown below:
| www.newinti.edu.my seen from pinger2 (Raspberry) | www.newinti.edu.my seen from pinger(N4 |
|---|---|---|
Loss and RTTs (msec) |
|
|
Frequency Distributions |
|
|
Cumulative Frequency Distributions |
|
|
We also used PingER (pingtable.pl) with 100 byte pings to look at the average RTTs from the two UNIMAS monitoring hosts to remotes sites in Malaysia. This was downloaded into Excel, a spreadsheet was created and Excel used to analyze the data and create histograms, see below.
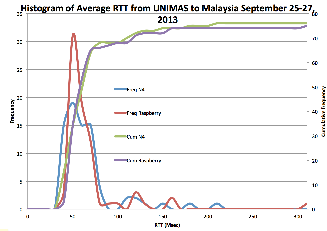
There is more difference in this case, however whether it is statistically significant needs more data and further analysis.