Introduction
Test the filter for runs where hits were seen.
Use cxi49012 from 2012-02-06 runs 115-153.
Analysis with Cheetah
Files from
/reg/d/psdm/cxi/cxi49012/scratch/hdf5/r0150-a/
(also available r0150-HG0, r0150-kb)
HDF5 structure:
Input file name  : /reg/d/psdm/cxi/cxi49012/scratch/hdf5/r0150-a/LCLS_2012_Feb06_r0150_194829_1585d_cspad.h5
<HDF5 file "LCLS_2012_Feb06_r0150_194829_1585d_cspad.h5" (mode r, 6.6M)> (File) /
     data (Group) /data
                  /data/data                  len = (1480, 1552)
                  /data/rawdata               len = (1480, 1552)
                  /data/radialAverageCounter  len = (1178,)
                  /data/radialAverage         len = (1178,)
     processing (Group) /processing
                        /processing/pixelmasks                   len = (1480, 1552)
                        /processing/hitfinder
                        /processing/hitfinder/peakinfo-raw       len = (7, 4)
                        /processing/hitfinder/peakinfo-assembled len = (7, 4)
                        /processing/hitfinder/peakinfo           len = (7, 4)
     LCLS (Group) /LCLS
                  /LCLS/ebeamLTUPosY           len = (1,)
                  /LCLS/ebeamLTUPosX           len = (1,)
                  /LCLS/f_21_ENRC              len = (1,)
                  /LCLS/eventTime              len = ()
                  /LCLS/phaseCavityCharge2     len = (1,)
                  /LCLS/evr41                  len = (1,)
                  /LCLS/detectorPosition       len = (1,)
                  /LCLS/f_11_ENRC              len = (1,)
                  /LCLS/photon_wavelength_A    len = (1,)
                  /LCLS/ebeamLTUAngY           len = (1,)
                  /LCLS/ebeamLTUAngX           len = (1,)
                  /LCLS/fiducial               len = (1,)
                  /LCLS/photon_energy_eV       len = (1,)
                  /LCLS/ebeamPkCurrBC2         len = (1,)
                  /LCLS/ebeamL3Energy          len = (1,)
                  /LCLS/machineTime            len = (1,)
                  /LCLS/cspadQuadTemperature   len = (4,)
                  /LCLS/detectorEncoderValue   len = (1,)
                  /LCLS/f_22_ENRC              len = (1,)
                  /LCLS/phaseCavityCharge1     len = (1,)
                  /LCLS/phaseCavityTime1       len = (1,)
                  /LCLS/phaseCavityTime2       len = (1,)
                  /LCLS/ebeamCharge            len = (1,)
                  /LCLS/f_12_ENRC              len = (1,)
                  /LCLS/eventTimeString        len = ()
The End
Time is available as:
/LCLS/eventTime: Mon Feb 6 19:48:29 2012
/LCLS/eventTimeString: Mon Feb 6 19:48:29 2012
/LCLS/machineTime: 1328586509
/LCLS/phaseCavityTime1: 7.37246259e-316
/LCLS/phaseCavityTime2: 0.
/LCLS/fiducial: 88157 that is 0x1585d as in the name of the file
- Time in nanosecond is missing in the A.Barty's event hdf5 format.
- Fiducial is missing in xtc->hdf5 translation.
- There is no way to make sure that we compare the same events...
Log file:
/reg/d/psdm/cxi/cxi49012/scratch/hdf5/r0150-a/log.txt
>-------- Start of ini params --------<
defaultPhotonEnergyeV=5978.421875
defaultCameraLengthMm=-999.000000
detectorType=cspad
detectorName=CxiDs1
startAtFrame=0
stopAtFrame=0
nThreads=16
useHelperThreads=0
ioSpeedTest=0
threadPurge=10000
geometry=/reg/neh/home/hgliu/cxi/cxi49012/scratch/hgliu/pixmap/feb12_geo.h5
darkcal=/reg/d/ana12/cxi/cxi49012/scratch/hgliu/darcal/r0040-darkcal.h5
gaincal=/reg/d/psdm/cxi/cxi49012/scratch/cheetah/calib/gain_map.h5
peakmask=
badPixelMap=/reg/neh/home/knass/2012jan/scratch/knass/scripts/badpix-combo3.h5
subtractcmModule=0
cmModule=0
subtractUnbondedPixels=0
wiremaskFile=No_file_specified
subtractBehindWires=0
useGaincal=0
invertGain=0
generateDarkcal=0
generateGaincal=0
useBadPixelMap=1
useDarkcalSubtraction=1
hitfinder=1
saveHits=1
savePeakInfo=1
saveRaw=1
saveAssembled=0
saveDetectorCorrectedOnly=1
saveDetectorRaw=0
hdf5dump=0
saveInterval=1000
useAutoHotPixel=0
maskSaturatedPixels=1
pixelSaturationADC=15565
maskSaturatedPixels=1
pixelSaturationADC=15565
useSubtractPersistentBackground=0
useBackgroundBufferMutex=1
useLocalBackgroundSubtraction=0
localBackgroundRadius=3
tofName=CxiSc1
tofChannel=0
hitfinderUseTOF=0
hitfinderTOFMinSample=0
hitfinderTOFMaxSample=19999
hitfinderTOFThresh=0.100000
saveRadialStacks=0
radialStackSize=10000
cmFloor=0.100000
pixelSize=0.000110
debugLevel=2
hotpixFreq=0.900000
hotpixADC=1000
hotpixMemory=50
powderThresh=-20000
powderSumHits=1
powderSumBlanks=1
hitfinderADC=400
hitfinderNAT=2
hitfinderTIT=1000.000000
hitfinderCheckGradient=0
hitfinderMinGradient=0.000000
hitfinderCluster=0
hitfinderNPeaks=5
hitfinderNPeaksMax=1000
hitfinderAlgorithm=6
hitfinderMinPixCount=3
hitfinderMaxPixCount=20
hitfinderCheckPeakSeparation=0
hitfinderMaxPeakSeparation=5.000000
hitfinderSubtractLocalBG=0
hitfinderLocalBGRadius=4
hitfinderLocalBGThickness=1
hitfinderLimitRes=0
hitfinderMinRes=20.000000
hitfinderMaxRes=2.000000
hitfinderUsePeakMask=0
hitfinderMinSNR=15.000000
selfdarkMemory=50
bgMemory=50
bgRecalc=50
bgMedian=0.500000
bgIncludeHits=0
bgNoBeamReset=0
bgFiducialGlitchReset=0
scaleBackground=0
startFrames=0
>-------- End of ini params --------<
>-------- Start of job --------<
nFrames: 1000, nHits: 20 (2.00%), recentHits: 20 (2.00%), wallTime: 0hr 0min 51sec (19.6 fps)
nFrames: 2000, nHits: 20 (1.00%), recentHits: 0 (0.00%), wallTime: 0hr 2min 4sec (16.1 fps)
nFrames: 3000, nHits: 43 (1.43%), recentHits: 23 (2.30%), wallTime: 0hr 3min 2sec (16.5 fps)
nFrames: 4000, nHits: 43 (1.08%), recentHits: 0 (0.00%), wallTime: 0hr 4min 1sec (16.6 fps)
nFrames: 5000, nHits: 56 (1.12%), recentHits: 13 (1.30%), wallTime: 0hr 4min 56sec (16.9 fps)
nFrames: 6000, nHits: 109 (1.82%), recentHits: 53 (5.30%), wallTime: 0hr 5min 43sec (17.5 fps)
nFrames: 7000, nHits: 221 (3.16%), recentHits: 112 (11.20%), wallTime: 0hr 6min 53sec (16.9 fps)
nFrames: 8000, nHits: 254 (3.18%), recentHits: 33 (3.30%), wallTime: 0hr 7min 47sec (17.1 fps)
nFrames: 9000, nHits: 528 (5.87%), recentHits: 274 (27.40%), wallTime: 0hr 9min 4sec (16.5 fps)
>-------- End of job --------<
End time: Mon Feb 6 20:28:14 2012
Elapsed time: 0hr 9min 43sec
Frames processed: 9534
nFrames in powder patterns:
class0: 9006
class1: 528
Number of hits: 528
Average hit rate: 5.54 %
Average frame rate: 16.35 fps
Average data rate: 71.65 MB/sec
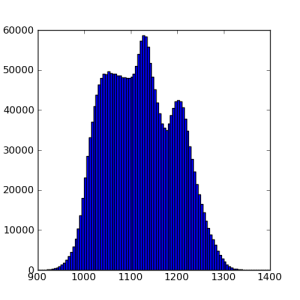
Average photon energy: 5989.52 eV
Photon energy sigma: 6.60 eV
Selected events:
LCLS_2012_Feb06_r0150_194813_14270_cspad:
LCLS_2012_Feb06_r0150_194829_1585d_cspad
LCLS_2012_Feb06_r0150_194833_15f20_cspad
Analysis of cxi49012-r0150 in PSANA
General info about cxi49012-r0150
- operator: aquila (Andrew L. Aquila)
- analysis: hgliu (Haiguang Liu)
- start / end time: 19:47:19 / 19:48:39
- duration: 1 min 20 sec
- total 9534 events
- sample: RC Batch: Q1 Buffer: 100 ?l protein , 100 ?l lipidic sponge ...
Pedestals
Configuration file psana-cxi49012-r0133-pedestals.cfg for pedestals evaluation:
[psana]
modules = ImgAlgos.CSPadArrAverage
files   = /reg/d/psdm/cxi/cxi49012/xtc/e158-r0133-s00-c00.xtc \
          /reg/d/psdm/cxi/cxi49012/xtc/e158-r0133-s01-c00.xtc \
          /reg/d/psdm/cxi/cxi49012/xtc/e158-r0133-s02-c00.xtc \
          /reg/d/psdm/cxi/cxi49012/xtc/e158-r0133-s03-c00.xtc \
          /reg/d/psdm/cxi/cxi49012/xtc/e158-r0133-s04-c00.xtc \
          /reg/d/psdm/cxi/cxi49012/xtc/e158-r0133-s05-c00.xtc

#skip-events = 0
#events      = 100

[ImgAlgos.CSPadArrAverage]
source  = DetInfo(CxiDs1.0:Cspad.0)
key     =
avefile = cspad-cxi49012-r0133-pedestals-ave.dat
rmsfile = cspad-cxi49012-r0133-pedestals-rms.dat
print_bits  =  15
evts_stage1 = 100
evts_stage2 = 100
gate_width1 = 200
gate_width2 =  20
Runs with dark images: 115, 116, 121 127, 129, 133.
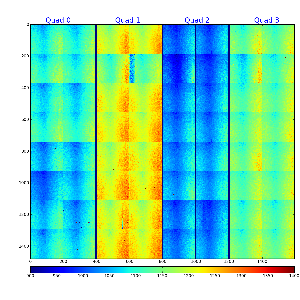
Pedestals from run 133:
Background
Portion of the configuration file psana-cxi49012-r0150-background-average.cfg for background averaging:
[ImgAlgos.CSPadArrAverage]
source        = DetInfo(CxiDs1.0:Cspad.0)
key           = calibrated
avefile       = ana-cxi49012/cspad-cxi49012-r0150-background-ave.dat
rmsfile       = ana-cxi49012/cspad-cxi49012-r0150-background-rms.dat
print_bits    = 15
Files with background as cspad array averaged for different event ranges:
cspad-cxi49012-r0150-background-ave-0-end.dat
cspad-cxi49012-r0150-background-ave-0-1000.dat
cspad-cxi49012-r0150-background-ave-1000-2000.dat
cspad-cxi49012-r0150-background-ave-2000-3000.dat
cspad-cxi49012-r0150-background-ave-4000-5000.dat
cspad-cxi49012-r0150-background-ave-7000-8000.dat
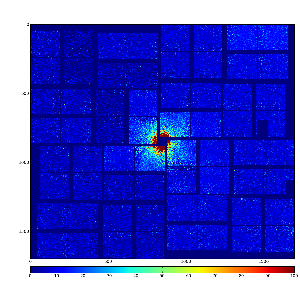
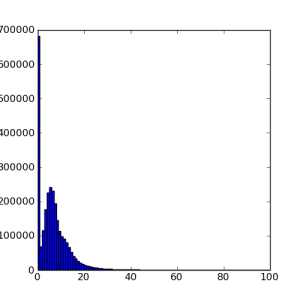
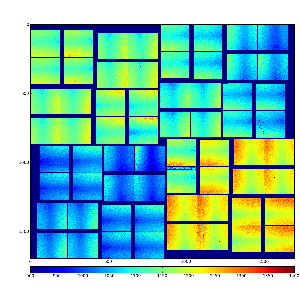
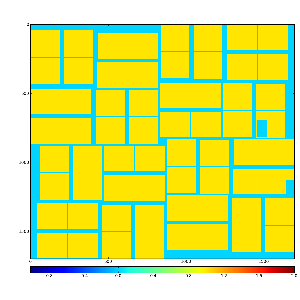
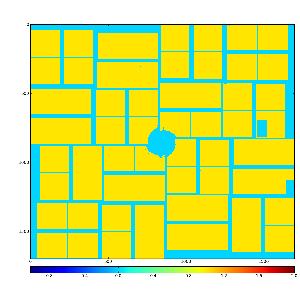
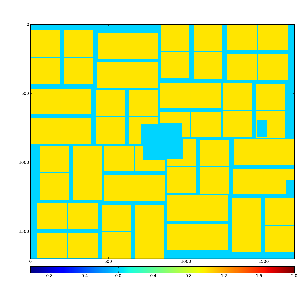
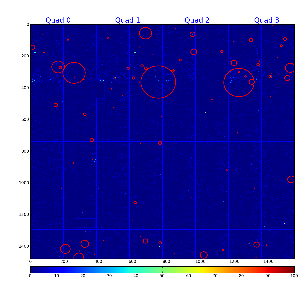
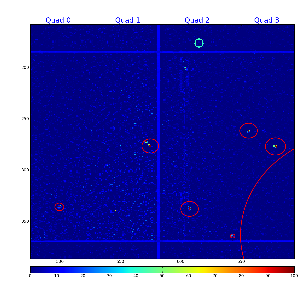
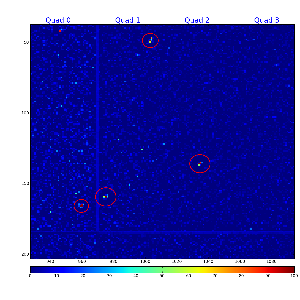
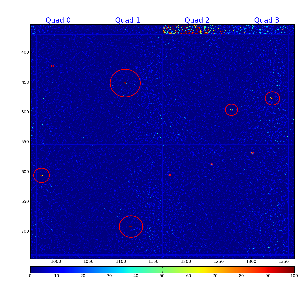
Images of Run 150 background averaged for event ranges: 0-end (9534), 0-1000, 2000-3000, 7000-8000:
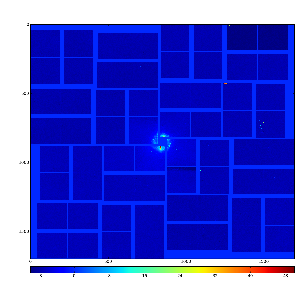
Because of
- the shape of background is differen during the run, and
- the
CSPadArrPeakFinderwill subtract background level by definition,
we will not subtract the background by theCSPadBkgdSubtract.
Mask
Command to generate mask:
./MakePixelMask.py ana-cxi49012/cspad-cxi49012-r0150-background-ave.dat 0
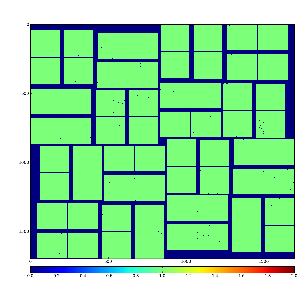
Three type of mask have been generated:
- cspad-cxi49012-r0150-mask-badregs.dat - masks bad regions of 2x1 only
- cspad-cxi49012-r0150-mask-bkgd.dat - masks the high background central region
- cspad-cxi49012-r0150-mask-rects.dat - rectangular mask of the high background central region
Initial mask for noisy pixels
Use the first 50 events to define the noisy pixel:
[ImgAlgos.CSPadArrNoise]
source          = DetInfo(CxiDs1.0:Cspad.0)
key             = calibrated
fracfile        = ana-cxi49012/cspad-cxi49012-r0150-noise-frac.dat
maskfile        = ana-cxi49012/cspad-cxi49012-r0150-noise-mask.dat
print_bits      = 255
rmin            = 3
dr              = 1
SoNThr          = 3
frac_noisy_imgs = 0.15
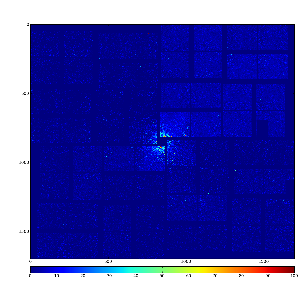
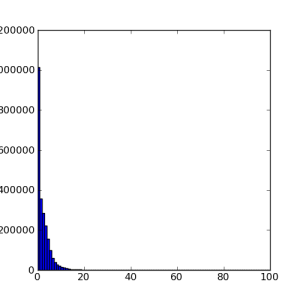
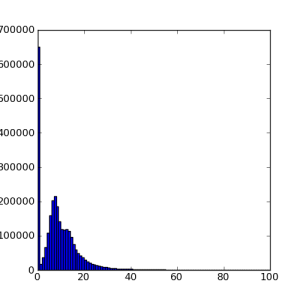
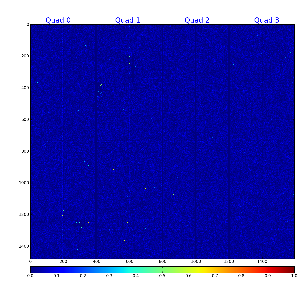
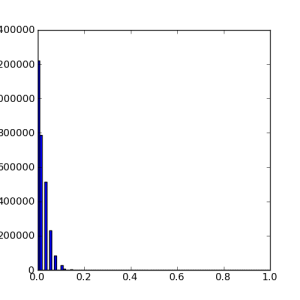
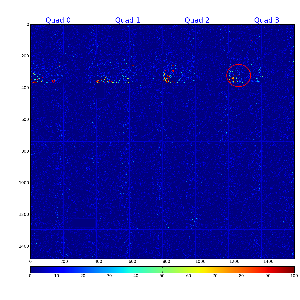
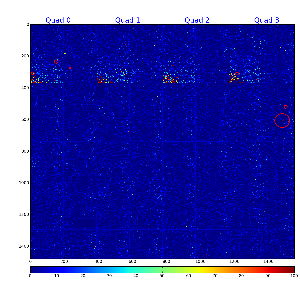
Array, image, and spectrum of fraction of noisy frames:

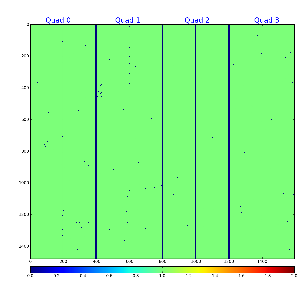
Array and image of the mask for noisy pixels:
Run peak finder CSPadArrPeakFinder
[psana]
files   = \
   /reg/d/psdm/cxi/cxi49012/xtc/e158-r0150-s00-c00.xtc \
   /reg/d/psdm/cxi/cxi49012/xtc/e158-r0150-s01-c00.xtc \
   /reg/d/psdm/cxi/cxi49012/xtc/e158-r0150-s02-c00.xtc \
   /reg/d/psdm/cxi/cxi49012/xtc/e158-r0150-s03-c00.xtc \
   /reg/d/psdm/cxi/cxi49012/xtc/e158-r0150-s04-c00.xtc \
   /reg/d/psdm/cxi/cxi49012/xtc/e158-r0150-s05-c00.xtc

#skip-events = 1000
#events      = 23

modules = cspad_mod.CsPadCalib \
          ImgAlgos.CSPadMaskApply \
          ImgAlgos.CSPadArrPeakFinder
#          ImgAlgos.CSPadArrSaveInFile


[cspad_mod.CsPadCalib]
inputKey      =
outputKey     = calibrated
doPedestals   = yes
doPixelStatus = no
doCommonMode  = no


[ImgAlgos.CSPadMaskApply]
source            = DetInfo(CxiDs1.0:Cspad.0)
inkey             = calibrated
outkey            = masked_arr
mask_fname        = ana-cxi49012/cspad-cxi49012-r0150-mask-badregs.dat
#mask_fname        = ana-cxi49012/cspad-cxi49012-r0150-mask-bkgd.dat
#mask_fname        = ana-cxi49012/cspad-cxi49012-r0150-mask-rects.dat
masked_amp        =  8
print_bits        =  1
mask_control_bits = 15

[ImgAlgos.CSPadArrPeakFinder]
source            = DetInfo(CxiDs1.0:Cspad.0)
key               = masked_arr
key_peaks_out     = peaks
hot_pix_mask_inp_file = ana-cxi49012/cspad-cxi49012-r0150-noise-mask.dat
hot_pix_mask_out_file = ana-cxi49012/cspad-cxi49012-r0150-noise-mask-out.dat
frac_noisy_evts_file  = ana-cxi49012/cspad-cxi49012-r0150-noise-frac.dat
evt_file_out      = tmp/cspad-ev-
rmin              =     3
dr                =     1
SoNThr            =     3
frac_noisy_imgs   =   0.1
peak_npix_min     =     4
peak_npix_max     =    25
peak_amp_tot_thr  =   100.
event_npeak_min   =    10
event_amp_tot_thr =  1000.
nevents_mask_update = 100
nevents_mask_accum  =  50

selection_mode    = SELECTION_ON
out_file_bits     =    15
print_bits        =    512
[info:TimeInterval::startTime] Start time: 2012-06-13 10:01:09 and 837008000 nsec
[info:ImgAlgos.CSPadArrPeakFinder]
   NFrames:    1000  NHits:      71 (  7.10%)  Time:    473.930 sec ( 2.110 fps)
   NFrames:    2000  NHits:      71 (  3.55%)  Time:    918.985 sec ( 2.176 fps)
   NFrames:    3000  NHits:     102 (  3.40%)  Time:   1376.008 sec ( 2.180 fps)
   NFrames:    4000  NHits:     102 (  2.55%)  Time:   1822.940 sec ( 2.194 fps)
   NFrames:    5000  NHits:     120 (  2.40%)  Time:   2290.219 sec ( 2.183 fps)
   NFrames:    6000  NHits:     182 (  3.03%)  Time:   2757.514 sec ( 2.176 fps)
   NFrames:    7000  NHits:     311 (  4.44%)  Time:   3248.353 sec ( 2.155 fps)
   NFrames:    8000  NHits:     357 (  4.46%)  Time:   3806.922 sec ( 2.101 fps)
   NFrames:    9000  NHits:     686 (  7.62%)  Time:   4366.899 sec ( 2.061 fps)
 ===== JOB SUMMARY =====
   NFrames:    9534  NHits:     686 (  7.20%)  Time:   4607.013 sec ( 2.069 fps)
[info:TimeInterval::stopTime] Time to process 9534 events is 4607.01 sec, or 0.483 sec/event
Needs to be compared with Cheetah selection-a log file:
/reg/d/psdm/cxi/cxi49012/scratch/hdf5/r0150-a/log.txt
>-------- Start of job --------<
nFrames: 1000,  nHits: 20 (2.00%), recentHits: 20 (2.00%), wallTime: 0hr 0min 51sec (19.6 fps)
nFrames: 2000,  nHits: 20 (1.00%), recentHits: 0 (0.00%), wallTime: 0hr 2min 4sec (16.1 fps)
nFrames: 3000,  nHits: 43 (1.43%), recentHits: 23 (2.30%), wallTime: 0hr 3min 2sec (16.5 fps)
nFrames: 4000,  nHits: 43 (1.08%), recentHits: 0 (0.00%), wallTime: 0hr 4min 1sec (16.6 fps)
nFrames: 5000,  nHits: 56 (1.12%), recentHits: 13 (1.30%), wallTime: 0hr 4min 56sec (16.9 fps)
nFrames: 6000,  nHits: 109 (1.82%), recentHits: 53 (5.30%), wallTime: 0hr 5min 43sec (17.5 fps)
nFrames: 7000,  nHits: 221 (3.16%), recentHits: 112 (11.20%), wallTime: 0hr 6min 53sec (16.9 fps)
nFrames: 8000,  nHits: 254 (3.18%), recentHits: 33 (3.30%), wallTime: 0hr 7min 47sec (17.1 fps)
nFrames: 9000,  nHits: 528 (5.87%), recentHits: 274 (27.40%), wallTime: 0hr 9min 4sec (16.5 fps)
>-------- End of job --------<
End time: Mon Feb  6 20:28:14 2012
Elapsed time: 0hr 9min 43sec
Frames processed: 9534
Number of hits: 528
Average hit rate: 5.54 %
Average frame rate: 16.35 fps
Average data rate: 71.65 MB/sec
Average photon energy: 5989.52  eV
Photon energy sigma:  6.60 eV
2012-06-14 Comparison of selected events in PSANA vs Cheetah selection-a
- Fiducials are missing in psana data
- Nanoseconds are missing in Cheetah-based analysis
- We need external info to check matching of selected events
Command pyxtcreader <list-of-xtc-files> | grep L1Accept > file-time-to-fiducial generates a list of frame headers, which contain both the timestamp and fiducial, like time=1328586439.927456987, fiducials=63221,....
We also use the file name of saved frames in Cheetah, like LCLS_2012_Feb06_r0150_194740_11456_cspad.h5, and in PSANA, like cspad-ev-000443-r0150-2012-02-06-194723.342595531-peaks.txt in order to check matching.
The matching algorithm loops over frames in all run 150 files and check if the Cheetah and/or PSANA have selected particular frame. For Cheetah it checks:
- date,
- HHMMSS,
- fiducials.
For PSANA it checks
- date,
- HHMMSS,
- nanoseconds.
The portion of the matching algorithm log file:Frame: 8928 1328586514 sec 25313196 nsec fiducials: 89906 HHMMSS: 194834 date: 20120206 isInCheetah: False isInPSANA: False Frame: 8929 1328586514 sec 33643630 nsec fiducials: 89909 HHMMSS: 194834 date: 20120206 isInCheetah: False isInPSANA: True Frame: 8930 1328586514 sec 41973933 nsec fiducials: 89912 HHMMSS: 194834 date: 20120206 isInCheetah: True isInPSANA: True Frame: 8931 1328586514 sec 50302898 nsec fiducials: 89915 HHMMSS: 194834 date: 20120206 isInCheetah: False isInPSANA: False Frame: 8932 1328586514 sec 58634037 nsec fiducials: 89918 HHMMSS: 194834 date: 20120206 isInCheetah: True isInPSANA: True Frame: 8933 1328586514 sec 66961663 nsec fiducials: 89921 HHMMSS: 194834 date: 20120206 isInCheetah: False isInPSANA: False Frame: 8934 1328586514 sec 75294182 nsec fiducials: 89924 HHMMSS: 194834 date: 20120206 isInCheetah: True isInPSANA: True Frame: 8935 1328586514 sec 83622351 nsec fiducials: 89927 HHMMSS: 194834 date: 20120206 isInCheetah: False isInPSANA: False Frame: 8936 1328586514 sec 91952812 nsec fiducials: 89930 HHMMSS: 194834 date: 20120206 isInCheetah: False isInPSANA: False Frame: 8937 1328586514 sec 100280993 nsec fiducials: 89933 HHMMSS: 194834 date: 20120206 isInCheetah: True isInPSANA: True
Result for all counters:
 Total number of frames in file  : 9534
 Total number of hits in Cheetah : 528
 Total number of hits in PSANA   : 686
 Non-found hits in both          : 8831
 Found in both                   : 511
 Found in PSANA only             : 175
 Found in Cheetah only           : 17
Summary
For current set of parameters
- ImgAlgos.CSPadArrPeakFinder selects 7.20% of hits
- Cheetah saves 5.87% of hits
- PSANA missed 17 and selected extra 175 events versus Cheetah for more than 500 selected frames.
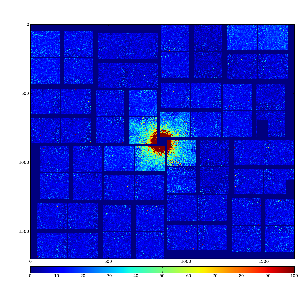
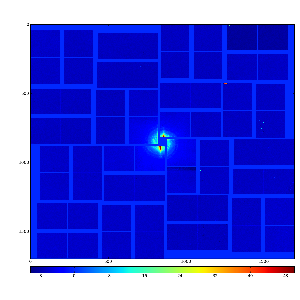
Selected events
ev-007713:

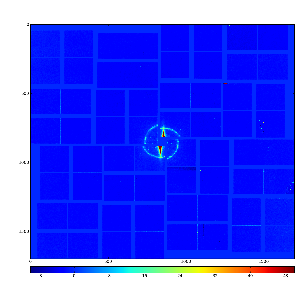
ev-008944:

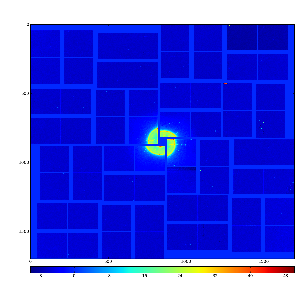
Events selected by Cheetah only
Most of 17 events, selected by Cheetah only, were not selected by the CSPadArrPeakFinder because 9 peaks were found only in stead of required 10.
Example of events:

2012-06-18 Change selection from 10 peaks to 9
[info:TimeInterval::startTime] Start time: 2012-06-18 16:41:01 and 651642000 nsec
[info:ImgAlgos.CSPadArrPeakFinder]   NFrames:    1000  NHits:      84 (  8.40%)  Time:    478.098 sec ( 2.092 fps)
[info:ImgAlgos.CSPadArrPeakFinder]   NFrames:    2000  NHits:      84 (  4.20%)  Time:    926.035 sec ( 2.160 fps)
[info:ImgAlgos.CSPadArrPeakFinder]   NFrames:    3000  NHits:     116 (  3.87%)  Time:   1383.505 sec ( 2.168 fps)
[info:ImgAlgos.CSPadArrPeakFinder]   NFrames:    4000  NHits:     116 (  2.90%)  Time:   1832.200 sec ( 2.183 fps)
[info:ImgAlgos.CSPadArrPeakFinder]   NFrames:    5000  NHits:     135 (  2.70%)  Time:   2285.611 sec ( 2.188 fps)
[info:ImgAlgos.CSPadArrPeakFinder]   NFrames:    6000  NHits:     203 (  3.38%)  Time:   2754.092 sec ( 2.179 fps)
[info:ImgAlgos.CSPadArrPeakFinder]   NFrames:    7000  NHits:     340 (  4.86%)  Time:   3247.141 sec ( 2.156 fps)
[info:ImgAlgos.CSPadArrPeakFinder]   NFrames:    8000  NHits:     390 (  4.88%)  Time:   3712.526 sec ( 2.155 fps)
[info:ImgAlgos.CSPadArrPeakFinder]   NFrames:    9000  NHits:     736 (  8.18%)  Time:   4278.251 sec ( 2.104 fps)
[info:ImgAlgos.CSPadArrPeakFinder] ===== JOB SUMMARY =====
[info:ImgAlgos.CSPadArrPeakFinder]   NFrames:    9534  NHits:     736 (  7.72%)  Time:   4516.692 sec ( 2.111 fps)
[info:TimeInterval::stopTime] Time to process 9534 events is 4516.69 sec, or 0.473746 sec/event
Comparison of selected events in PSANA vs Cheetah selection-a
Result for all counters:
 Total number of frames          : 9534
 Total number of hits in Cheetah : 528
 Total number of hits in PSANA   : 736
 Non-found hits in both          : 8788
 Found in both                   : 518
 Found in PSANA only             : 218
 Found in Cheetah only           : 10
10 Events selected by Cheetah only
Frame: 6084   1328586490 sec   334312132 nsec   fiducials: 81374    HHMMSS: 194810    date: 20120206   isInCheetah: True   isInPSANA: False
Frame: 6504   1328586493 sec   832694890 nsec   fiducials: 82634    HHMMSS: 194813    date: 20120206   isInCheetah: True   isInPSANA: False
Frame: 6553   1328586494 sec   240845567 nsec   fiducials: 82781    HHMMSS: 194814    date: 20120206   isInCheetah: True   isInPSANA: False
Frame: 6851   1328586496 sec   723213642 nsec   fiducials: 83675    HHMMSS: 194816    date: 20120206   isInCheetah: True   isInPSANA: False
Frame: 6974   1328586497 sec   747879423 nsec   fiducials: 84044    HHMMSS: 194817    date: 20120206   isInCheetah: True   isInPSANA: False
Frame: 6994   1328586497 sec   914490230 nsec   fiducials: 84104    HHMMSS: 194817    date: 20120206   isInCheetah: True   isInPSANA: False
Frame: 7911   1328586505 sec   553606864 nsec   fiducials: 86855    HHMMSS: 194825    date: 20120206   isInCheetah: True   isInPSANA: False
Frame: 8440   1328586509 sec   960190204 nsec   fiducials: 88442    HHMMSS: 194829    date: 20120206   isInCheetah: True   isInPSANA: False
Frame: 8449   1328586510 sec   35161608 nsec   fiducials: 88469    HHMMSS: 194830    date: 20120206   isInCheetah: True   isInPSANA: False
Frame: 8452   1328586510 sec   60152788 nsec   fiducials: 88478    HHMMSS: 194830    date: 20120206   isInCheetah: True   isInPSANA: False
2012-06-21 Speed-up processing using multithreading
Log file shows that speed of this algorithm is about 2fps, that is slow. This speed is defined by the median evaluation for each pixel of the image over about 50 remote neighbor pixels. PSANA framework supplies data for each quad. For each section of the quad the median algorithm does independent processing, that can be done in parallel in multithreading mode. We use the OpenMP procedure
#pragma omp parallel for
just before the for loop over all available CSPAD sections of the quad. For the thread-safe processing the code inside the for loop is modified in order to isolate all variables and output data in different threads. Comparative difference between speed of the single-thread and multi-treading modes is shown below.
In multithreading mode:
[info:ImgAlgos.CSPadArrPeakFinder]   NFrames:    1000  NHits:     163 ( 16.30%)  Time:    160.467 sec ( 6.232 fps)
[info:ImgAlgos.CSPadArrPeakFinder]   NFrames:    2000  NHits:     163 (  8.15%)  Time:    279.290 sec ( 7.161 fps)
[info:ImgAlgos.CSPadArrPeakFinder]   NFrames:    3000  NHits:     203 (  6.77%)  Time:    400.101 sec ( 7.498 fps)
[info:ImgAlgos.CSPadArrPeakFinder]   NFrames:    4000  NHits:     203 (  5.07%)  Time:    522.545 sec ( 7.655 fps)
[info:ImgAlgos.CSPadArrPeakFinder]   NFrames:    5000  NHits:     236 (  4.72%)  Time:    648.397 sec ( 7.711 fps)
[info:ImgAlgos.CSPadArrPeakFinder]   NFrames:    6000  NHits:     359 (  5.98%)  Time:    797.908 sec ( 7.520 fps)
[info:ImgAlgos.CSPadArrPeakFinder]   NFrames:    7000  NHits:     593 (  8.47%)  Time:    970.897 sec ( 7.210 fps)
[info:ImgAlgos.CSPadArrPeakFinder]   NFrames:    8000  NHits:     689 (  8.61%)  Time:   1116.850 sec ( 7.163 fps)
[info:ImgAlgos.CSPadArrPeakFinder]   NFrames:    9000  NHits:    1165 ( 12.94%)  Time:   1372.103 sec ( 6.559 fps)
[info:ImgAlgos.CSPadArrPeakFinder] ===== JOB SUMMARY =====
[info:ImgAlgos.CSPadArrPeakFinder]   NFrames:    9534  NHits:    1165 ( 12.22%)  Time:   1451.644 sec ( 6.568 fps)
[info:TimeInterval::stopTime] Time to process 9534 events is 1451.64 sec, or 0.15226 sec/event
dubrovin@psana0204
Snapshots from top:
PID   USER      PR  NI  VIRT  RES  SHR S %CPU  %MEM    TIME+ COMMAND
31250 dubrovin  16   0 1126m 250m  16m R 426.1  3.1  83:20.34 psana
31250 dubrovin  16   0  998m 212m  16m R 515.2  2.7  93:06.69 psana
31250 dubrovin  16   0 1062m 239m  16m R 278.5  3.0  94:49.83 psana
31250 dubrovin  16   0 1126m 259m  16m R 440.5  3.2 100:26.43 psana
Single-thread mode
[info:ImgAlgos.CSPadArrPeakFinder]   NFrames:    1000  NHits:     163 ( 16.30%)  Time:    503.288 sec ( 1.987 fps)
[info:ImgAlgos.CSPadArrPeakFinder]   NFrames:    2000  NHits:     163 (  8.15%)  Time:    949.256 sec ( 2.107 fps)
[info:ImgAlgos.CSPadArrPeakFinder]   NFrames:    3000  NHits:     203 (  6.77%)  Time:   1408.933 sec ( 2.129 fps)
[info:ImgAlgos.CSPadArrPeakFinder]   NFrames:    4000  NHits:     203 (  5.07%)  Time:   1855.885 sec ( 2.155 fps)
[info:ImgAlgos.CSPadArrPeakFinder]   NFrames:    5000  NHits:     236 (  4.72%)  Time:   2312.426 sec ( 2.162 fps)
[info:ImgAlgos.CSPadArrPeakFinder]   NFrames:    6000  NHits:     359 (  5.98%)  Time:   2798.862 sec ( 2.144 fps)
[info:ImgAlgos.CSPadArrPeakFinder]   NFrames:    7000  NHits:     593 (  8.47%)  Time:   3321.919 sec ( 2.107 fps)
[info:ImgAlgos.CSPadArrPeakFinder]   NFrames:    8000  NHits:     689 (  8.61%)  Time:   3798.451 sec ( 2.106 fps)
[info:ImgAlgos.CSPadArrPeakFinder]   NFrames:    9000  NHits:    1165 ( 12.94%)  Time:   4406.237 sec ( 2.043 fps)
[info:ImgAlgos.CSPadArrPeakFinder] ===== JOB SUMMARY =====
[info:ImgAlgos.CSPadArrPeakFinder]   NFrames:    9534  NHits:    1165 ( 12.22%)  Time:   4644.862 sec ( 2.053 fps)
[info:TimeInterval::stopTime] Time to process 9534 events is 4644.86 sec, or 0.487189 sec/event
dubrovin@psana0204
Snapshots from top:
PID   USER      PR  NI  VIRT  RES  SHR S %CPU  %MEM    TIME+ COMMAND
31736 dubrovin  18   0 1088m 269m  16m R 102.2  3.4  26:18.80 psana
31736 dubrovin  18   0 1024m 249m  16m R 104.0  3.1  28:00.43 psana
31736 dubrovin  17   0 1024m 250m  16m R  99.0  3.1  44:54.80 psana
31736 dubrovin  19   0 1088m 269m  16m R 103.5  3.4  48:24.64 psana
Comparison of selected events in PSANA vs Cheetah selection-a
Result for all counters:
 Total number of frames          : 9534
 Total number of hits in Cheetah : 528
 Total number of hits in PSANA   : 1165
 Non-found hits in both          : 8368
 Found in both                   : 527
 Found in PSANA only             : 638
 Found in Cheetah only           : 1
- In this version PSANA missed 1 event only, that is 0.01%.
- Parameters of the
CSPadArrPeakFinderhave not been changed. - Code has been changed for thread-safe operations.
- It may happen due to persistence in member-data, which was eliminated in new code.
Summary for multithreading
- Great success is acheived in isolation of data and parameters between threads.
- All crashes disappeared
- Single- and multi-threading modes select exactly the same set of events
- Multithreading allows to speed-up the
CSPadArrPeakFinderin 6.568fps / 2.053fps about 3 times.
2012-06-27 Tuning of parameters
After meeting with Anton the peak finder parameters are changed;
SoNThr=3is changed toSoNThr_noise=3- Add {{SoNThr_signal=8}
frac_noisy_imgs=0.9(it was 0.1)- remove amplitude thresholds in ADU
peak_amp_tot_thr=0.andevent_amp_tot_thr=0. - Add
event_npeak_max=10000 - Changed
nevents_mask_update=0(it was 100) so the mask of noisy pixels is updated every 50 events without any gap.
[ImgAlgos.CSPadArrPeakFinder]
source            = DetInfo(CxiDs1.0:Cspad.0)
key               = masked_arr
key_peaks_out     = peaks
#key_signal_out    = signal-arr
#hot_pix_mask_inp_file = ana-cxi49012/cspad-cxi49012-r0150-noise-mask.dat
hot_pix_mask_out_file = ana-cxi49012/cspad-cxi49012-r0150-noise-mask-out.dat
frac_noisy_evts_file  = ana-cxi49012/cspad-cxi49012-r0150-noise-frac.dat
evt_file_out        = tmp/cspad-ev-
rmin                =     3
dr                  =     1
SoNThr_noise        =     3
SoNThr_signal       =     8
frac_noisy_imgs     =   0.9
peak_npix_min       =     3
peak_npix_max       =    25
peak_amp_tot_thr    =     0.
event_npeak_min     =     9
event_npeak_max     = 10000
event_amp_tot_thr   =     0.
nevents_mask_update =     0
nevents_mask_accum  =    50
selection_mode      = SELECTION_ON
out_file_bits       =     12
#out_file_bits      =      0
print_bits          =    579
Results
[info:ImgAlgos.CSPadArrPeakFinder]   Event:9499  Collected for mask update:50  Statistics: Nnoisy:147  Ntotal:2296960  Nnoisy/Ntotal pixels:6.39976e-05
[info:ImgAlgos.CSPadArrPeakFinder]   NFrames:    9534  NHits:     784 (  8.22%)  Time:   1480.257 sec ( 6.441 fps), or 0.155261 sec/event
Comparison with Cheetah
 Cheetah selection version       : a       : HG0            : kb
 Total number of frames          : 9534    : 9534           : 9534
 Total number of hits in Cheetah : 528     : 187            : 317
 Total number of hits in PSANA   : 784     : 784            : 784
 Non-selected frames in both     : 8742    : 8750           : 8746
 Found in both                   : 520     : 187            : 313
 Found in PSANA only             : 264     : 597            : 471
 Found in Cheetah only           : 8       : 0              : 4
Overview
Content Tools