Introduction
Test the filter for runs where hits were seen.
Use cxi49012 from 2012-02-06 runs 115-153.
Analysis with Cheetah
Files from
/reg/d/psdm/cxi/cxi49012/scratch/hdf5/r0150-a/
(also available r0150-HG0, r0150-kb)
HDF5 structure:
Input file name  : /reg/d/psdm/cxi/cxi49012/scratch/hdf5/r0150-a/LCLS_2012_Feb06_r0150_194829_1585d_cspad.h5
<HDF5 file "LCLS_2012_Feb06_r0150_194829_1585d_cspad.h5" (mode r, 6.6M)> (File) /
     data (Group) /data
                  /data/data                  len = (1480, 1552)
                  /data/rawdata               len = (1480, 1552)
                  /data/radialAverageCounter  len = (1178,)
                  /data/radialAverage         len = (1178,)
     processing (Group) /processing
                        /processing/pixelmasks                   len = (1480, 1552)
                        /processing/hitfinder
                        /processing/hitfinder/peakinfo-raw       len = (7, 4)
                        /processing/hitfinder/peakinfo-assembled len = (7, 4)
                        /processing/hitfinder/peakinfo           len = (7, 4)
     LCLS (Group) /LCLS
                  /LCLS/ebeamLTUPosY           len = (1,)
                  /LCLS/ebeamLTUPosX           len = (1,)
                  /LCLS/f_21_ENRC              len = (1,)
                  /LCLS/eventTime              len = ()
                  /LCLS/phaseCavityCharge2     len = (1,)
                  /LCLS/evr41                  len = (1,)
                  /LCLS/detectorPosition       len = (1,)
                  /LCLS/f_11_ENRC              len = (1,)
                  /LCLS/photon_wavelength_A    len = (1,)
                  /LCLS/ebeamLTUAngY           len = (1,)
                  /LCLS/ebeamLTUAngX           len = (1,)
                  /LCLS/fiducial               len = (1,)
                  /LCLS/photon_energy_eV       len = (1,)
                  /LCLS/ebeamPkCurrBC2         len = (1,)
                  /LCLS/ebeamL3Energy          len = (1,)
                  /LCLS/machineTime            len = (1,)
                  /LCLS/cspadQuadTemperature   len = (4,)
                  /LCLS/detectorEncoderValue   len = (1,)
                  /LCLS/f_22_ENRC              len = (1,)
                  /LCLS/phaseCavityCharge1     len = (1,)
                  /LCLS/phaseCavityTime1       len = (1,)
                  /LCLS/phaseCavityTime2       len = (1,)
                  /LCLS/ebeamCharge            len = (1,)
                  /LCLS/f_12_ENRC              len = (1,)
                  /LCLS/eventTimeString        len = ()
The End
Time is available as:
/LCLS/eventTime: Mon Feb 6 19:48:29 2012
/LCLS/eventTimeString: Mon Feb 6 19:48:29 2012
/LCLS/machineTime: 1328586509
/LCLS/phaseCavityTime1: 7.37246259e-316
/LCLS/phaseCavityTime2: 0.
/LCLS/fiducial: 88157 that is 0x1585d as in the name of the file
- Time in nanosecond is missing in the A.Barty's event hdf5 format.
- Fiducial is missing in xtc->hdf5 translation.
- There is no way to make sure that we compare the same events...
Log file:
/reg/d/psdm/cxi/cxi49012/scratch/hdf5/r0150-a/log.txt
>-------- Start of job --------<
nFrames: 1000, nHits: 20 (2.00%), recentHits: 20 (2.00%), wallTime: 0hr 0min 51sec (19.6 fps)
nFrames: 2000, nHits: 20 (1.00%), recentHits: 0 (0.00%), wallTime: 0hr 2min 4sec (16.1 fps)
nFrames: 3000, nHits: 43 (1.43%), recentHits: 23 (2.30%), wallTime: 0hr 3min 2sec (16.5 fps)
nFrames: 4000, nHits: 43 (1.08%), recentHits: 0 (0.00%), wallTime: 0hr 4min 1sec (16.6 fps)
nFrames: 5000, nHits: 56 (1.12%), recentHits: 13 (1.30%), wallTime: 0hr 4min 56sec (16.9 fps)
nFrames: 6000, nHits: 109 (1.82%), recentHits: 53 (5.30%), wallTime: 0hr 5min 43sec (17.5 fps)
nFrames: 7000, nHits: 221 (3.16%), recentHits: 112 (11.20%), wallTime: 0hr 6min 53sec (16.9 fps)
nFrames: 8000, nHits: 254 (3.18%), recentHits: 33 (3.30%), wallTime: 0hr 7min 47sec (17.1 fps)
nFrames: 9000, nHits: 528 (5.87%), recentHits: 274 (27.40%), wallTime: 0hr 9min 4sec (16.5 fps)
>-------- End of job --------<
End time: Mon Feb 6 20:28:14 2012
Elapsed time: 0hr 9min 43sec
Frames processed: 9534
nFrames in powder patterns:
class0: 9006
class1: 528
Number of hits: 528
Average hit rate: 5.54 %
Average frame rate: 16.35 fps
Average data rate: 71.65 MB/sec
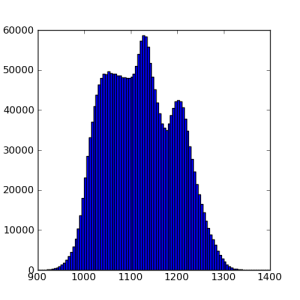
Average photon energy: 5989.52 eV
Photon energy sigma: 6.60 eV
Selected events:
LCLS_2012_Feb06_r0150_194813_14270_cspad:
LCLS_2012_Feb06_r0150_194829_1585d_cspad
LCLS_2012_Feb06_r0150_194833_15f20_cspad
Analysis of cxi49012-r0150 in PSANA
General info about cxi49012-r0150
- operator: aquila (Andrew L. Aquila)
- analysis: hgliu (Haiguang Liu)
- start / end time: 19:47:19 / 19:48:39
- duration: 1 min 20 sec
- total 9534 events
- sample: RC Batch: Q1 Buffer: 100 ?l protein , 100 ?l lipidic sponge ...
Pedestals
Configuration file psana-cxi49012-r0133-pedestals.cfg for pedestals evaluation:
[psana]
modules = ImgAlgos.CSPadArrAverage
files   = /reg/d/psdm/cxi/cxi49012/xtc/e158-r0133-s00-c00.xtc \
          /reg/d/psdm/cxi/cxi49012/xtc/e158-r0133-s01-c00.xtc \
          /reg/d/psdm/cxi/cxi49012/xtc/e158-r0133-s02-c00.xtc \
          /reg/d/psdm/cxi/cxi49012/xtc/e158-r0133-s03-c00.xtc \
          /reg/d/psdm/cxi/cxi49012/xtc/e158-r0133-s04-c00.xtc \
          /reg/d/psdm/cxi/cxi49012/xtc/e158-r0133-s05-c00.xtc

#skip-events = 0
#events      = 100

[ImgAlgos.CSPadArrAverage]
source  = DetInfo(CxiDs1.0:Cspad.0)
key     =
avefile = cspad-cxi49012-r0133-pedestals-ave.dat
rmsfile = cspad-cxi49012-r0133-pedestals-rms.dat
print_bits  =  15
evts_stage1 = 100
evts_stage2 = 100
gate_width1 = 200
gate_width2 =  20
Runs with dark images: 115, 116, 121 127, 129, 133.
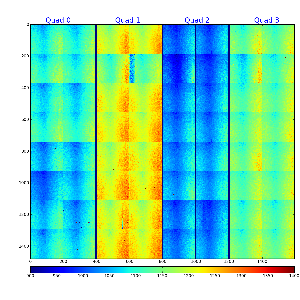
Pedestals from run 133:
Background
Portion of the configuration file psana-cxi49012-r0150-background-average.cfg for background averaging:
[ImgAlgos.CSPadArrAverage]
source        = DetInfo(CxiDs1.0:Cspad.0)
key           = calibrated
avefile       = ana-cxi49012/cspad-cxi49012-r0150-background-ave.dat
rmsfile       = ana-cxi49012/cspad-cxi49012-r0150-background-rms.dat
print_bits    = 15
Files with background as cspad array averaged for different event ranges:
cspad-cxi49012-r0150-background-ave-0-end.dat
cspad-cxi49012-r0150-background-ave-0-1000.dat
cspad-cxi49012-r0150-background-ave-1000-2000.dat
cspad-cxi49012-r0150-background-ave-2000-3000.dat
cspad-cxi49012-r0150-background-ave-4000-5000.dat
cspad-cxi49012-r0150-background-ave-7000-8000.dat
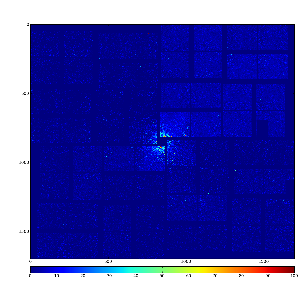
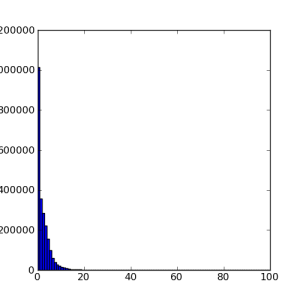
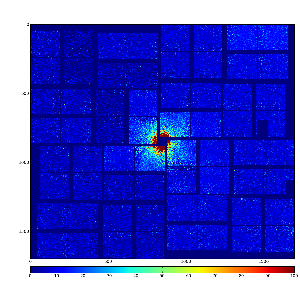
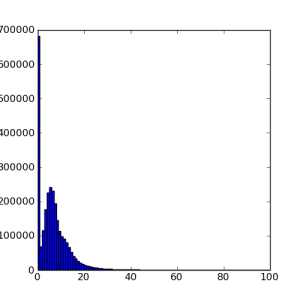
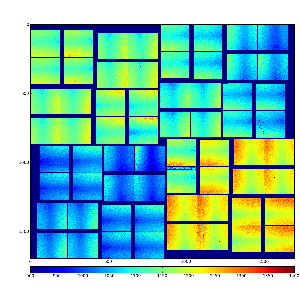
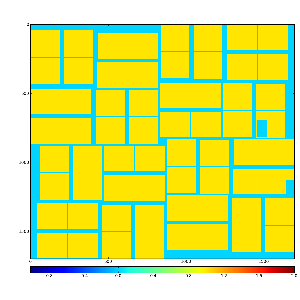
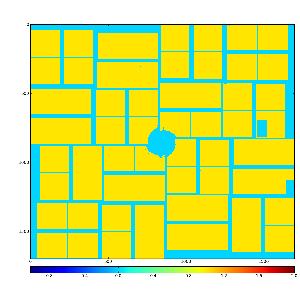
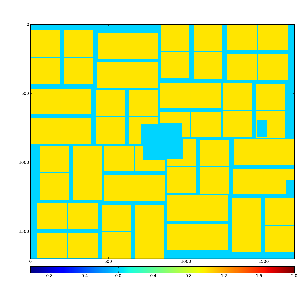
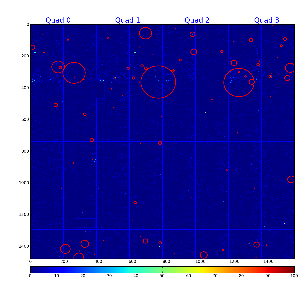
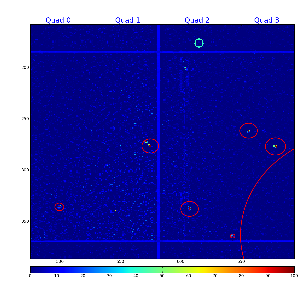
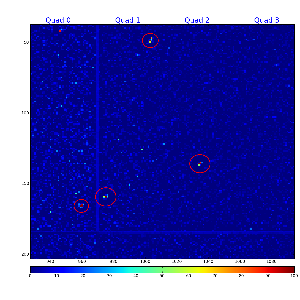
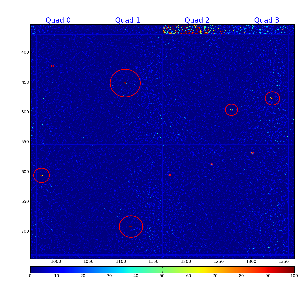
Images of Run 150 background averaged for event ranges: 0-end (9534), 0-1000, 2000-3000, 7000-8000:
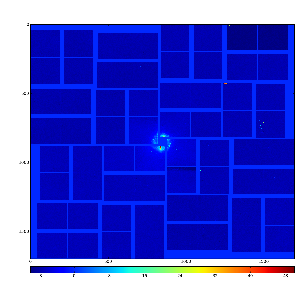
Because of
- the shape of background is differen during the run, and
- the
CSPadArrPeakFinderwill subtract background level by definition,
we will not subtract the background by theCSPadBkgdSubtract.
Mask
Command to generate mask:
./MakePixelMask.py ana-cxi49012/cspad-cxi49012-r0150-background-ave.dat 0
Three type of mask have been generated:
- cspad-cxi49012-r0150-mask-badregs.dat - masks bad regions of 2x1 only
- cspad-cxi49012-r0150-mask-bkgd.dat - masks the high background central region
- cspad-cxi49012-r0150-mask-rects.dat - rectangular mask of the high background central region
Initial mask for noisy pixels
Use the first 50 events to define the noisy pixel:
[ImgAlgos.CSPadArrNoise]
source          = DetInfo(CxiDs1.0:Cspad.0)
key             = calibrated
fracfile        = ana-cxi49012/cspad-cxi49012-r0150-noise-frac.dat
maskfile        = ana-cxi49012/cspad-cxi49012-r0150-noise-mask.dat
print_bits      = 255
rmin            = 3
dr              = 1
SoNThr          = 3
frac_noisy_imgs = 0.15
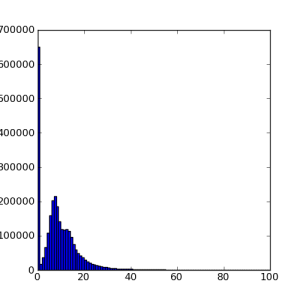
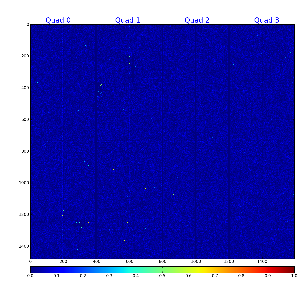
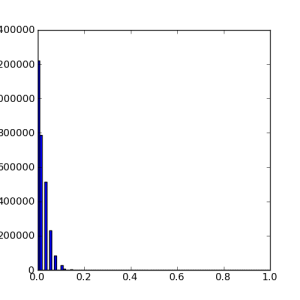
Array, image, and spectrum of fraction of noisy frames:

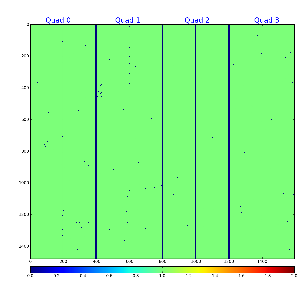
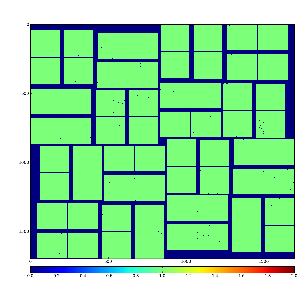
Array and image of the mask for noisy pixels:
Run peak finder CSPadArrPeakFinder
[psana]
files   = \
   /reg/d/psdm/cxi/cxi49012/xtc/e158-r0150-s00-c00.xtc \
   /reg/d/psdm/cxi/cxi49012/xtc/e158-r0150-s01-c00.xtc \
   /reg/d/psdm/cxi/cxi49012/xtc/e158-r0150-s02-c00.xtc \
   /reg/d/psdm/cxi/cxi49012/xtc/e158-r0150-s03-c00.xtc \
   /reg/d/psdm/cxi/cxi49012/xtc/e158-r0150-s04-c00.xtc \
   /reg/d/psdm/cxi/cxi49012/xtc/e158-r0150-s05-c00.xtc

#skip-events = 1000
#events      = 23

modules = cspad_mod.CsPadCalib \
          ImgAlgos.CSPadMaskApply \
          ImgAlgos.CSPadArrPeakFinder
#          ImgAlgos.CSPadArrSaveInFile


[cspad_mod.CsPadCalib]
inputKey      =
outputKey     = calibrated
doPedestals   = yes
doPixelStatus = no
doCommonMode  = no


[ImgAlgos.CSPadMaskApply]
source            = DetInfo(CxiDs1.0:Cspad.0)
inkey             = calibrated
outkey            = masked_arr
mask_fname        = ana-cxi49012/cspad-cxi49012-r0150-mask-badregs.dat
#mask_fname        = ana-cxi49012/cspad-cxi49012-r0150-mask-bkgd.dat
#mask_fname        = ana-cxi49012/cspad-cxi49012-r0150-mask-rects.dat
masked_amp        =  8
print_bits        =  1
mask_control_bits = 15

[ImgAlgos.CSPadArrPeakFinder]
source            = DetInfo(CxiDs1.0:Cspad.0)
key               = masked_arr
key_peaks_out     = peaks
hot_pix_mask_inp_file = ana-cxi49012/cspad-cxi49012-r0150-noise-mask.dat
hot_pix_mask_out_file = ana-cxi49012/cspad-cxi49012-r0150-noise-mask-out.dat
frac_noisy_evts_file  = ana-cxi49012/cspad-cxi49012-r0150-noise-frac.dat
evt_file_out      = tmp/cspad-ev-
rmin              =     3
dr                =     1
SoNThr            =     3
frac_noisy_imgs   =   0.1
peak_npix_min     =     4
peak_npix_max     =    25
peak_amp_tot_thr  =   100.
event_npeak_min   =    10
event_amp_tot_thr =  1000.
nevents_mask_update = 100
nevents_mask_accum  =  50

selection_mode    = SELECTION_ON
out_file_bits     =    15
print_bits        =    512
[info:TimeInterval::startTime] Start time: 2012-06-13 10:01:09 and 837008000 nsec
[info:ImgAlgos.CSPadArrPeakFinder]
   NFrames:    1000  NHits:      71 (  7.10%)  Time:    473.930 sec ( 2.110 fps)
   NFrames:    2000  NHits:      71 (  3.55%)  Time:    918.985 sec ( 2.176 fps)
   NFrames:    3000  NHits:     102 (  3.40%)  Time:   1376.008 sec ( 2.180 fps)
   NFrames:    4000  NHits:     102 (  2.55%)  Time:   1822.940 sec ( 2.194 fps)
   NFrames:    5000  NHits:     120 (  2.40%)  Time:   2290.219 sec ( 2.183 fps)
   NFrames:    6000  NHits:     182 (  3.03%)  Time:   2757.514 sec ( 2.176 fps)
   NFrames:    7000  NHits:     311 (  4.44%)  Time:   3248.353 sec ( 2.155 fps)
   NFrames:    8000  NHits:     357 (  4.46%)  Time:   3806.922 sec ( 2.101 fps)
   NFrames:    9000  NHits:     686 (  7.62%)  Time:   4366.899 sec ( 2.061 fps)
 ===== JOB SUMMARY =====
   NFrames:    9534  NHits:     686 (  7.20%)  Time:   4607.013 sec ( 2.069 fps)
[info:TimeInterval::stopTime] Time to process 9534 events is 4607.01 sec, or 0.483 sec/event
Needs to be compared with Cheetah log file:
/reg/d/psdm/cxi/cxi49012/scratch/hdf5/r0150-a/log.txt
>-------- Start of job --------<
nFrames: 1000,  nHits: 20 (2.00%), recentHits: 20 (2.00%), wallTime: 0hr 0min 51sec (19.6 fps)
nFrames: 2000,  nHits: 20 (1.00%), recentHits: 0 (0.00%), wallTime: 0hr 2min 4sec (16.1 fps)
nFrames: 3000,  nHits: 43 (1.43%), recentHits: 23 (2.30%), wallTime: 0hr 3min 2sec (16.5 fps)
nFrames: 4000,  nHits: 43 (1.08%), recentHits: 0 (0.00%), wallTime: 0hr 4min 1sec (16.6 fps)
nFrames: 5000,  nHits: 56 (1.12%), recentHits: 13 (1.30%), wallTime: 0hr 4min 56sec (16.9 fps)
nFrames: 6000,  nHits: 109 (1.82%), recentHits: 53 (5.30%), wallTime: 0hr 5min 43sec (17.5 fps)
nFrames: 7000,  nHits: 221 (3.16%), recentHits: 112 (11.20%), wallTime: 0hr 6min 53sec (16.9 fps)
nFrames: 8000,  nHits: 254 (3.18%), recentHits: 33 (3.30%), wallTime: 0hr 7min 47sec (17.1 fps)
nFrames: 9000,  nHits: 528 (5.87%), recentHits: 274 (27.40%), wallTime: 0hr 9min 4sec (16.5 fps)
>-------- End of job --------<
End time: Mon Feb  6 20:28:14 2012
Elapsed time: 0hr 9min 43sec
Frames processed: 9534
Number of hits: 528
Average hit rate: 5.54 %
Average frame rate: 16.35 fps
Average data rate: 71.65 MB/sec
Average photon energy: 5989.52  eV
Photon energy sigma:  6.60 eV
2012-06-14
Comparison of selected events in PSANA vs Cheetah
- Fiducials are missing in psana data
- Nanoseconds are missing in Cheetah-based analysis
- We need external info to check matching of selected events
Command pyxtcreader <list-of-xtc-files> | grep L1Accept > file-time-to-fiducial generates a list of frame headers, which contain both the timestamp and fiducial, like time=1328586439.927456987, fiducials=63221,....
We also use the file name of saved frames in Cheetah, like LCLS_2012_Feb06_r0150_194740_11456_cspad.h5, and in PSANA, like cspad-ev-000443-r0150-2012-02-06-194723.342595531-peaks.txt in order to check matching.
The matching algorithm loops over frames in all run 150 files and check if the Cheetah and/or PSANA have selected particular frame. For Cheetah it checks:
- date,
- HHMMSS,
- fiducials.
For PSANA it checks
- date,
- HHMMSS,
- nanoseconds.
The portion of the matching algorithm log file:Frame: 8928 1328586514 sec 25313196 nsec fiducials: 89906 HHMMSS: 194834 date: 20120206 isInCheetah: False isInPSANA: False Frame: 8929 1328586514 sec 33643630 nsec fiducials: 89909 HHMMSS: 194834 date: 20120206 isInCheetah: False isInPSANA: True Frame: 8930 1328586514 sec 41973933 nsec fiducials: 89912 HHMMSS: 194834 date: 20120206 isInCheetah: True isInPSANA: True Frame: 8931 1328586514 sec 50302898 nsec fiducials: 89915 HHMMSS: 194834 date: 20120206 isInCheetah: False isInPSANA: False Frame: 8932 1328586514 sec 58634037 nsec fiducials: 89918 HHMMSS: 194834 date: 20120206 isInCheetah: True isInPSANA: True Frame: 8933 1328586514 sec 66961663 nsec fiducials: 89921 HHMMSS: 194834 date: 20120206 isInCheetah: False isInPSANA: False Frame: 8934 1328586514 sec 75294182 nsec fiducials: 89924 HHMMSS: 194834 date: 20120206 isInCheetah: True isInPSANA: True Frame: 8935 1328586514 sec 83622351 nsec fiducials: 89927 HHMMSS: 194834 date: 20120206 isInCheetah: False isInPSANA: False Frame: 8936 1328586514 sec 91952812 nsec fiducials: 89930 HHMMSS: 194834 date: 20120206 isInCheetah: False isInPSANA: False Frame: 8937 1328586514 sec 100280993 nsec fiducials: 89933 HHMMSS: 194834 date: 20120206 isInCheetah: True isInPSANA: True
Result for all counters:
 Total number of frames in file  : 9534
 Total number of hits in Cheetah : 528
 Total number of hits in PSANA   : 686
 Non-found hits in both          : 8831
 Found in both                   : 511
 Found in PSANA only             : 175
 Found in Cheetah only           : 17
Summary
For current set of parameters
- ImgAlgos.CSPadArrPeakFinder selects 7.20% of hits
- Cheetah saves 5.87% of hits
- PSANA missed 17 and selected extra 175 events versus Cheetah for more than 500 selected frames.
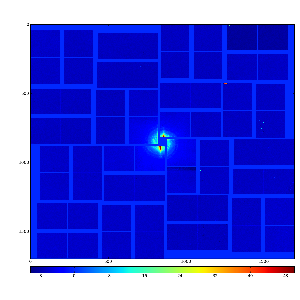
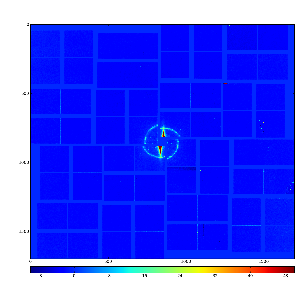
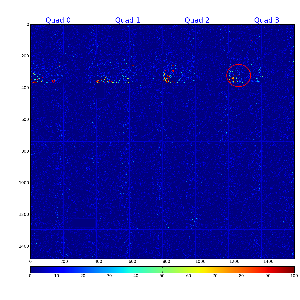
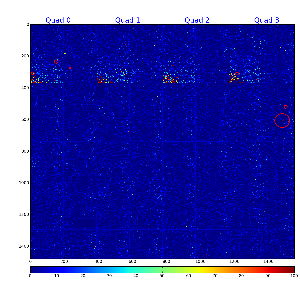
Selected events
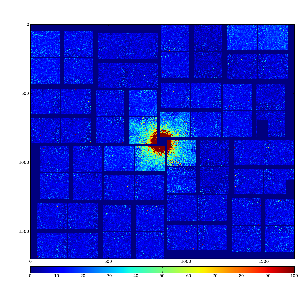
ev-007713:

ev-008944:

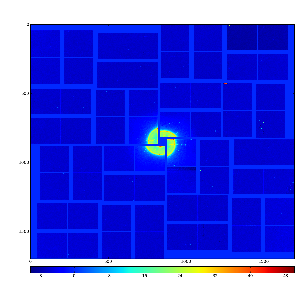
Events selected by Cheetah only
Most of 17 events, selected by Cheetah only, were not selected by the CSPadArrPeakFinder because 9 peaks were found only in stead of required 10.
Example of events:

2012-06-18
Change selection from 10 peaks to 9
[info:TimeInterval::startTime] Start time: 2012-06-18 16:41:01 and 651642000 nsec
[info:ImgAlgos.CSPadArrPeakFinder]   NFrames:    1000  NHits:      84 (  8.40%)  Time:    478.098 sec ( 2.092 fps)
[info:ImgAlgos.CSPadArrPeakFinder]   NFrames:    2000  NHits:      84 (  4.20%)  Time:    926.035 sec ( 2.160 fps)
[info:ImgAlgos.CSPadArrPeakFinder]   NFrames:    3000  NHits:     116 (  3.87%)  Time:   1383.505 sec ( 2.168 fps)
[info:ImgAlgos.CSPadArrPeakFinder]   NFrames:    4000  NHits:     116 (  2.90%)  Time:   1832.200 sec ( 2.183 fps)
[info:ImgAlgos.CSPadArrPeakFinder]   NFrames:    5000  NHits:     135 (  2.70%)  Time:   2285.611 sec ( 2.188 fps)
[info:ImgAlgos.CSPadArrPeakFinder]   NFrames:    6000  NHits:     203 (  3.38%)  Time:   2754.092 sec ( 2.179 fps)
[info:ImgAlgos.CSPadArrPeakFinder]   NFrames:    7000  NHits:     340 (  4.86%)  Time:   3247.141 sec ( 2.156 fps)
[info:ImgAlgos.CSPadArrPeakFinder]   NFrames:    8000  NHits:     390 (  4.88%)  Time:   3712.526 sec ( 2.155 fps)
[info:ImgAlgos.CSPadArrPeakFinder]   NFrames:    9000  NHits:     736 (  8.18%)  Time:   4278.251 sec ( 2.104 fps)
[info:ImgAlgos.CSPadArrPeakFinder] ===== JOB SUMMARY =====
[info:ImgAlgos.CSPadArrPeakFinder]   NFrames:    9534  NHits:     736 (  7.72%)  Time:   4516.692 sec ( 2.111 fps)
[info:TimeInterval::stopTime] Time to process 9534 events is 4516.69 sec, or 0.473746 sec/event
Comparison of selected events in PSANA vs Cheetah
Result for all counters:
 Total number of frames          : 9534
 Total number of hits in Cheetah : 528
 Total number of hits in PSANA   : 736
 Non-found hits in both          : 8788
 Found in both                   : 518
 Found in PSANA only             : 218
 Found in Cheetah only           : 10
Overview
Content Tools