In reference to the HEC meeting to be held in the last week of May 2011, we tried to analyse the network performance for PoP node (pingerjms.pern.edu.pk) and Non PoP node (pinger.usindh.edu.pk) both at University of Sindh Jamshoro.
Metric Measurements and Results
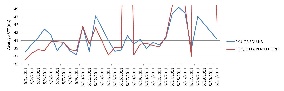
Looking at the pingtable.pl and getting data from Pakistan to pingerjms and Pakistan to usindh node, we see the following results that show the performance of both of the nodes in the first 15 days of May.
Find spreadsheet here.
The graphs clearly show that the PoP node performance is worse than the non-PoP node. In order to get a better insight into finding the reason of this degraded performance, we looked at the traceroutes for both of the nodes from pinger.pern.edu.pk (Islamabad Pern PoP). However, the traceroutes for both of the nodes are throwing error messages.
RTTs seen from PoP Islamabad (pinger.pern.edu.pk)
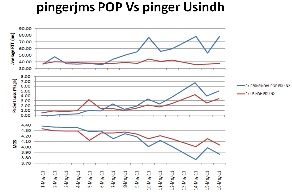
The next thing we want is to see the picture of network performance while accessing both of the nodes from one central node and not from whole of the Pakistan. For this, we chose PoP Islamabad as monitoring node and accessed Usindh (pinger.usindh.edu.pk) and Usindh PoP (pingerjms.pern.edu.pk)
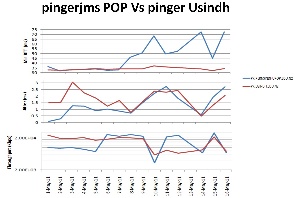
Going to http://www-wanmon.slac.stanford.edu/cgi-wrap/connectivity.pl?format=csv&rawdata=pinger.usindh.edu.pk&days=6&monitor=pinger.pern.edu.pk and http://www-wanmon.slac.stanford.edu/cgi-wrap/connectivity.pl?format=csv&rawdata=pingerjms.pern.edu.pk&days=6&monitor=pinger.pern.edu.pk we collected the data for past 7 days and plotted it in excel to see the curves for Average RTT and Min RTT.
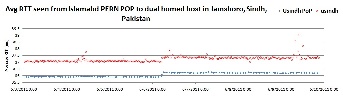
Looking at the graphs one can see that there are rapid fluctuations in the data values for each node. Because of which the graphs show a scattered plot with a number of data points above and below, which seem to be on the same point on x-axis. However looking at the spreadsheet, it is observed that two data values are collected for each half an hour, and these two values fluctuate by about 0.3 ~ 0.4 ms for PoP node while it fluctuates by 0.63ms for usndh non-PoP node. Although we don't know the reason for this fluctuation , however we know that this fluctuation is continuous for both of the nodes and for all 7 of the days.
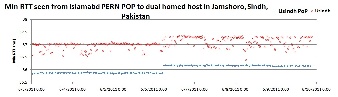
We see that the min of min RTT for PoP was 35.827ms , avg of min RTT was 36.164, max of min RTT was 36.48, IQR of min RTT was 0.294 (see table for pingerjms.pern.edu.pk column 1 and 2).
pingerjms.pern.edu.pk |
Min RTT (ms) |
Avg RTT (ms) |
Max RTT (ms) |
|---|---|---|---|
Min |
35.827 |
35.879 |
35.91 |
Avg |
36.164 |
36.21 |
36.29 |
Max |
36.48 |
36.623 |
37.934 |
Median |
36.159 |
36.201 |
36.264 |
IQR |
0.294 |
0.285 |
0.296 |
Similarly, we have the min, avg, max, median and IQR for Min RTT, Average RTT and Max RTT for the usindh node in the table shown below.
pinger.usindh.edu.pk |
Min RTT (ms) |
Avg RTT (ms) |
Max RTT (ms) |
|---|---|---|---|
Min |
36.388 |
36.973 |
37.057 |
Avg |
37.34 |
37.54 |
37.84 |
Max |
37.967 |
39.472 |
46.352 |
Median |
37.311 |
37.614 |
37.711 |
IQR |
0.609 |
0.622 |
0.619 |
These tables can also be viewed in the spreadsheet attached above.
On average there is a difference of 1.2ms in Min RTT, 1.33ms in Average RTT and 1.55ms in Max RTT for the two nodes. Usindh PoP is performing better than Usindh non-PoP node.
Traceroute Results from pinger.pern.edu.pk
While trying to access pingerjms.pern.edu.pk (PoP Jamshoro) from pinger.pern.edu.pk (PoP Islamabad) following traceroute results were obtained
Executing exec(traceroute, -m 30 -q 3 -f 3, 121.52.154.2, 140)
traceroute to 121.52.154.2 (121.52.154.2), 30 hops max, 140 byte packets
 4  rwp44.pie.net.pk (221.120.251.58)  35.530 ms  35.491 ms  35.424 ms
 5  khi77.pie.net.pk (221.120.205.70)  36.129 ms  36.417 ms  36.490 ms
 6  pinger.hyd.usindh.edu.pk (121.52.154.2)  35.945 ms  35.931 ms  35.916 ms
However, while accessing usindh (non PoP Jamshoro) we found
Executing exec(traceroute, -m 30 -q 3 -f 3, 121.52.155.62, 140)
traceroute to 121.52.155.62 (121.52.155.62), 30 hops max, 140 byte packets
 4  rwp44.pie.net.pk (221.120.251.58)  35.473 ms  35.442 ms  35.451 ms
 5  khi77.pie.net.pk (221.120.205.70)  36.107 ms  36.347 ms  36.388 ms
 6  172.31.253.66 (172.31.253.66)  36.077 ms  36.201 ms  36.248 ms
 7  usindh.edu.pk (121.52.156.130)  36.550 ms  36.583 ms  36.623 ms
 8   (121.52.155.62)  36.917 ms !X  36.899 ms !X  36.885 ms !X
Extra hops can be seen in Usindh traceroute (hop 6 and 7). For both of the nodes, it takes 36.105 ~ 36.4 ms to reach the hop khi77.pie.net.pk, however, as the hops are increased for accessing usindh , an increased RTT of 0.9 ms is observed. This is a small difference in RTT for the two nodes which is added due to two extra hops and it supports the results shown above in graphs.
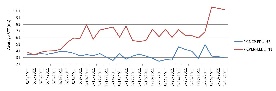
Comparison of Khi-PoP and Neduet
As the results of jamshoro and university of sindh do not go with the theoretical analysis, we tried to find out the performance of other PoPs as compared to one other pern node in the same city.
First we chose Karachi POP and NEDUET. For the time being we only compared the average RTT.
Karachi PoP is performing better than neduet.
Now we want to confirm it by checking some other POP and non POP pair.
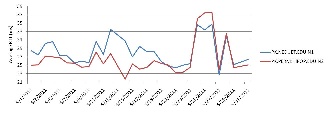
Comparison of Islamabad-PoP and NCP
We now tried to compare the average RTT from Pakistan to PERN POP Islamabad and to NCP (National College of Physics, Islamabad).
Here, it is seen that NCP performs way better than POP.
The results are not enough to reach a conclusion so we decided to make yet another comparison on a POP - Non PoP pair.
Comparison of Quetta-PoP and UOB
We here compared quetta POP and Non PoP.
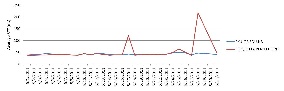
Resulting graph shows that the Quetta PoP and UOB perform quite same, however, looking at fine granulation it is observed that Quetta POP performs better than UOB but gives unreliable spikes which makes its performance worse. On the other hand, UOB has a consistent and stable performance.