Looking at the average round trip times between monitor.niit.edu.pk and pinger.uettaxila.edu.pk there is a sudden step down drop on April 25th 2011 from ~30ms to ~ 5ms. The reverse step happens on May 7th 2011. There is also an outage between March 17th and April 15th.
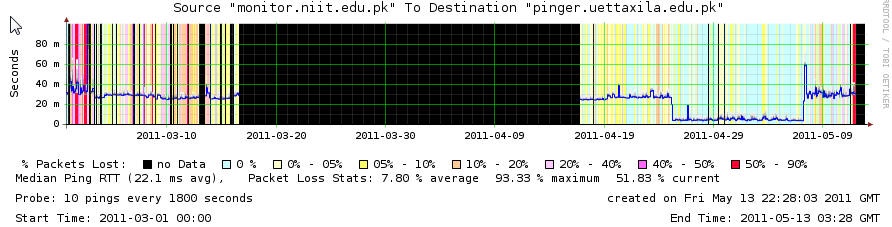
This is seen in both the SLAC and SEECS archive sites at http://www-wanmon.slac.stanford.edu/cgi-wrap/pingtable.pl?file=average_rtt&by=by-node&size=100&tick=last60days&from=PK.NIIT.EDU.N2&to=Pakistan&ex=none&only=all&dataset=hep&percentage=any and http://pinger.seecs.edu.pk/cgi-bin/pingtable.pl?file=average_rtt&by=by-node&size=100&tick=last60days&year=2011&month=05&from=PK.NIIT.EDU.N2&to=PK.UETTAXILA.EDU.N1&ex=none&dataset=hep&percentage=any
Looking at the raw data read from NIIT for UETAXILA it confirms RTT os ~ 5ms.
58cottrell@pinger:~>grep monitor /tmp/average_rtt-100-by-node-2011-05-01.txt \| grep uettax
monitor.niit.edu.pk pinger.uettaxila.edu.pk 3.590 4.021 4.021 4.226 5.036 6.491 7.223 6.147 6.389 7.042 7.042 5.601 5.601 6.365 6.365 6.588 4.592 4.951 5.030 7.237 6.474 5.321 4.780 4.739 monitor.niit.edu.pk pinger.uettaxila.edu.pk
pinger.uettaxila.edu.pk monitor.niit.edu.pk . 4.438 4.438 5.706 5.235 6.316 6.521 7.613 5.898 6.036 6.036 6.088 6.088 5.835 5.835 6.321 6.665 6.665 6.280 7.356 9.075 5.183 4.605 4.654 pinger.uettaxila.edu.pk monitor.niit.edu.pk
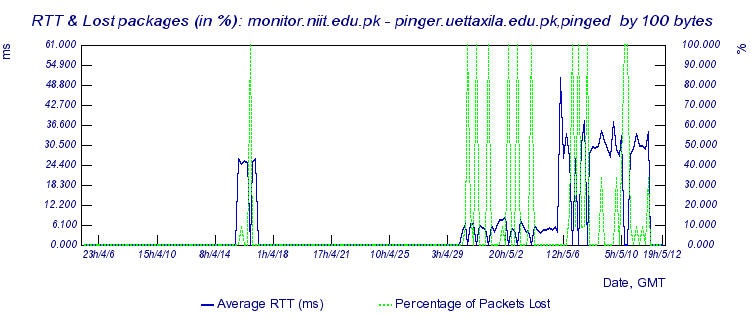
The drop in RTT is also confirmed looking at the FNAL graph:
Looking at the traceroutes from monitor.niit.edu.pk to uettaxila on one of the days of low Avg_RTT (here 5/1/2011) one gets the following message:
traceroute server busy at the moment. Please try again later. See The Naming System for information on host.domain and Addresses for information on Internet addresses.
To get a better view of the situation, we try to look at the reverse route i.e from pinger.uettaxila.edu.pk to monitor.niit.edu.pk. The smokeping graph thus obtained is: 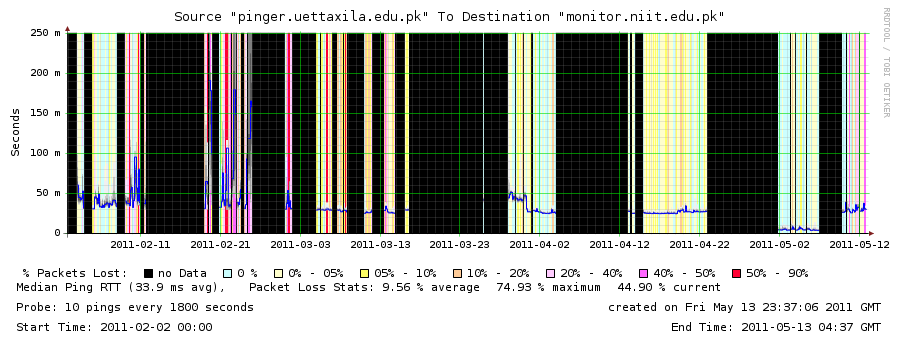
The smokeping graph shows that the node was showing a fluctuating UP/DOWN behavior during the last three months. However, the drop in Avg_RTT is observed here also (see at 2011-05-02).
Looking at the traceroutes from pinger.uettaxila.edu.pk to monitor.niit.edu.pk on one of the days of low Avg_RTT (here 5/1/2011) following output is observed:
Executing exec(traceroute, -m 30 -q 3 -f 3, 115.186.131.81, 140)
traceroute to 115.186.131.81 (115.186.131.81), 30 hops max, 140 byte packets
 3  rwp44.pie.net.pk (221.120.253.121)  5.457 ms  5.444 ms  5.435 ms
 4  rwp44.pie.net.pk (221.120.254.62)  6.247 ms  7.673 ms  7.667 ms
 5  rwp44.pie.net.pk (221.120.253.10)  4.555 ms  4.556 ms  4.547 ms
 6  rwp44.pie.net.pk (221.120.237.102)  4.538 ms  4.534 ms  4.529 ms
 7  58-65-175-206.nayatel.pk (58.65.175.206)  4.506 ms  4.500 ms  4.726 ms
 8  * 115-186-128-178.nayatel.pk (115.186.128.178)  6.589 ms  6.587 ms
 9  115-186-131-81.nayatel.pk (115.186.131.81)  6.429 ms  4.927 ms  4.914 ms
However today (5-13-2011) the traceroute output is given as:
Executing exec(traceroute, -m 30 -q 3 -f 3, 115.186.131.81, 140)
traceroute to 115.186.131.81 (115.186.131.81), 30 hops max, 140 byte packets
 3  rwp44.pie.net.pk (221.120.253.121)  4.624 ms  4.601 ms  4.590 ms
 4  rwp44.pie.net.pk (221.120.254.62)  4.566 ms  4.570 ms  5.414 ms
 5  rwp44.pie.net.pk (221.120.253.10)  4.267 ms  4.270 ms  4.273 ms
 6  rwp44.pie.net.pk (221.120.237.102)  4.265 ms  4.258 ms  4.773 ms
 7  58-65-175-206.nayatel.pk (58.65.175.206)  26.374 ms  26.374 ms  26.367 ms
 8  * * *
 9  * * *
10  * * *
11  * * *
12  * * *
13  * * *
14  * * *
15  * * *
16  * * *
17  * * *
18  * * *
19  * * *
20  * * *
21  * * *
22  * * *
23  * * *
24  * * *
25  * * *
26  * * *
27  * * *
28  * * *
29  * 115-186-131-81.nayatel.pk (115.186.131.81)  25.631 ms  25.617 ms