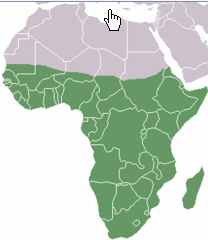
Coverage in Sub-Sahara region
UN Definition of Sub-Sahara |
World Internet Connection Density from Chris Harrison (http://chrisharrison.net/projects/InternetMap/index.html) |
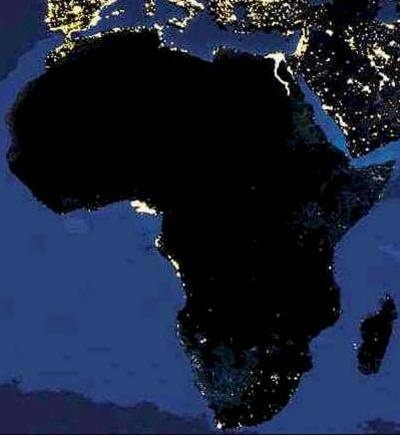
Light at night from Space |
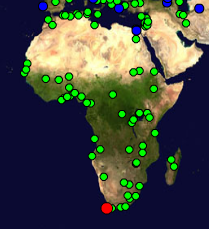
Pinger Deployment of Monitoring sites (red) & monitored sites (green) |
|
|
|
|


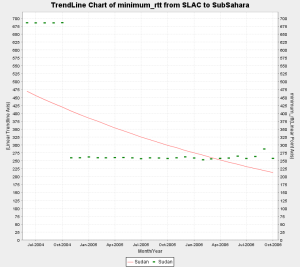
Interesting Trends:
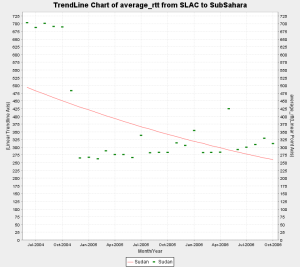
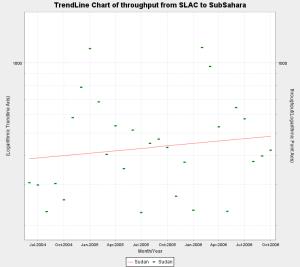
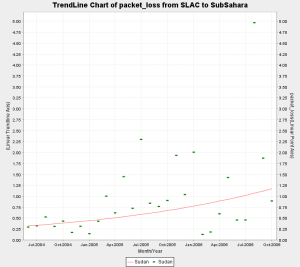
- Sudan shifted from average rtt of approx. 685 ms to approx. 260 ms in Nov 2004. This is a classic case of shift from Satellite to Fiber. However there is are no remarkable trends visible in the throughput. This is explained by the increase in packet loss over the same period of time. Thus the improvement in rtt was compensated by the increase in packet loss and the overall throughput fails to show any meaningful increasing trend.
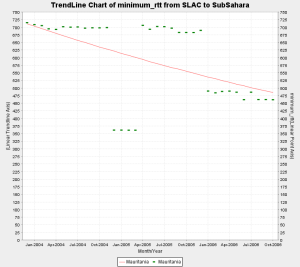
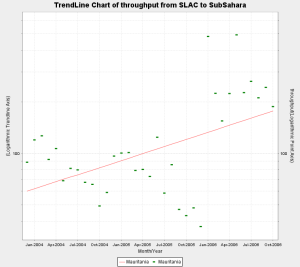
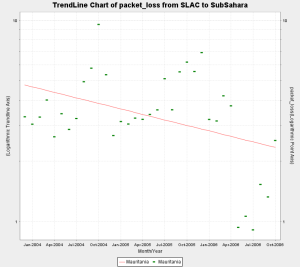
- Mauritania shows interesting behaviour. One of the hosts we monitor (www.pmd.mr) shows improved connectivity around Jan 2006 indicating a shift from satellite to landline. However the other host (www.maurifemme.mr), which is indicated as being on satellite and located in Norway (courtesy http://www.geoiptool.com) is showing the same rtt of around 680+ ms. If this host is actually in Mauritania then we can conclude that some parts of the country have shifted to fibre but others are still on satellite.
- In addition the throughput and packet loss for the both hosts show marked improvement since Jan 2006 which indicates better connectivity.
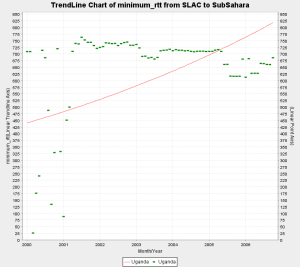
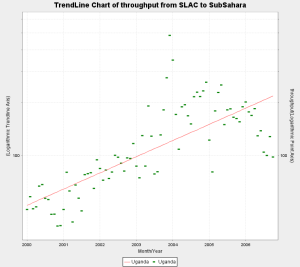
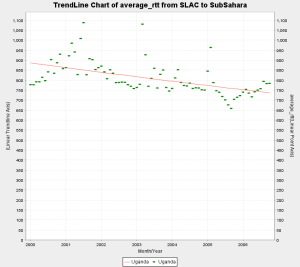
- Uganda has shown steady improvement in throughput and loss quality over the years since we started monitoring it in 2000. However the min_rtt of above 600 ms and the avg_rtt around 800 ms indicates that it is still mostly on Satellite.
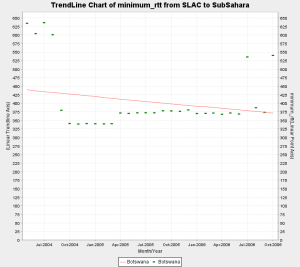
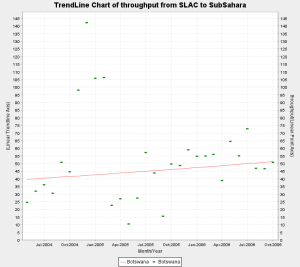
- Botswana shows a switch from satellite to fibre as the min_rtt switches from 600+ ms to around 350 ms around Sep 2004. Howver the packet loss and throughput do not show and particular trends which might indicate significant improvement.
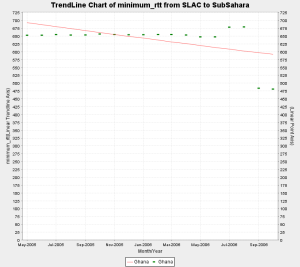
- Very recent data for Ghana i.e. (Sep and Oct 2006) inidcates a shift from satellite to fiber. In particular if we examine the individual hosts we monitor in Ghana, one of the hosts shows a step change from 680+ ms to 260+ms, while the other still continues to show satellite indicating that part of the coutry may be shifting to fibre. Further more when we looked up the asn on both the hosts, the asn for host performing poorly was described as INTELSAT while the host which is now performing better had an ASN description of "UNSPECIFIED, NETWORK COMPUTER SYSTEMS, ACCRA GHANA".
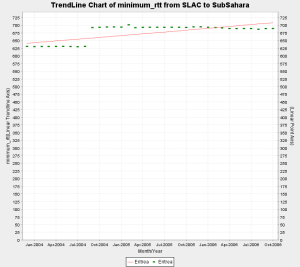
- There was a step change in the min RTT of Eritrea from 625 ms to 700 ms approx. in Sep, 2004.
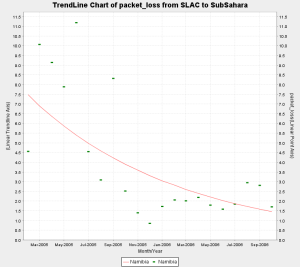
- The loss quality of Namibia shows steady improvement.
- The following countries are on Satellite since we began monitoring them:
- Ghana May, 2005
- Kenya April, 2004
- Madagascar Jan, 2004
- Malawi Sep, 2005
- Mozambique Jan, 2004
- Niger July, 2004
- Nigeria July, 2004
- Rwanda Mar, 2005
- Tanzania Jan, 2004
- Uganda Jan, 2000
- The following countries are on Fibre since we began monitoring them:
- Benin March, 2005
- Mali March, 2005
- Sinegal Jan ,2004
- S. Africa May, 2003
Maps of Connectivity from South Africa
An interesting way to analyze the state of internet connectivity in Africa is to look at colored maps of various metrics as seen from our monitoring node in South Africa.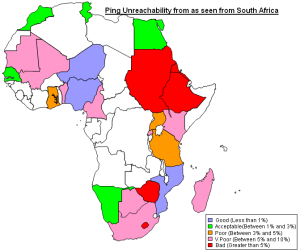
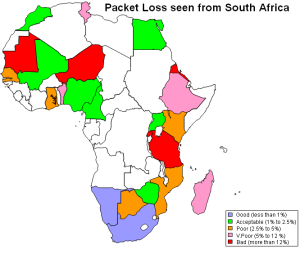
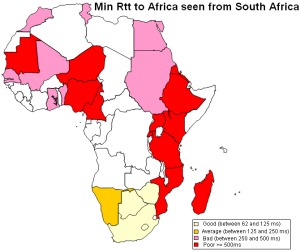
Ping Unreachability Packet Loss Min_rtt
Routing in Africa seen from SLAC
Using programs written to analyze traceroutes for different regions we have been able to generate topology maps of various regions in Africa as seen from SLAC. These maps provide a valuable insight into the various ASNs that are encountered as packets are routed from SLAC to Africa.


SLAC to West Africa SLAC to South Africa SLAC to East Africa
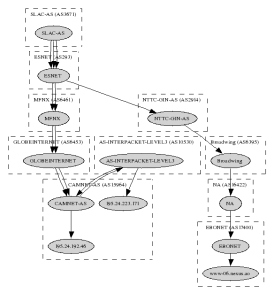
SLAC to Central Africa