Problem Statement:
After optimizing the Alpha value for different regions, when tests were run for targets of various regions, it was observed that results for only North America and Europe were improved and for other regions, Error distance still mounted to thousand of Kilometers. One observation was that this is mainly due to instability of internet connectivity in these regions and better results in Europe and North America are due to better and stable connectivity in those areas. However, another thing observed during the analysis was that these Europe and N. America each also possess a large number of landmarks compared to other regions. So the impact of landmark's density can't be ignored. It was observed that most of the times poor results appear mainly because of the fact that no landmark is found in the close vicinity of the target and hence eventhe even the three final selected landmarks with minimum RTT may have RTT values above 300ms or so.
...
Region |
| "Avg Distance of Landmarks" |
| "Avg Error Distance" |
|---|---|---|---|---|
Europe |
| 555.6404153 |
| 440.0434656 |
East Asia |
| 841.0220395 |
| 2966.42115 |
South Asia |
| 1006.405099 |
| 6379.043878 |
North America |
| 1756.877965 |
| 804.486103 |
Latin America |
| 1790.503606 |
| 5431.530291 |
Africa |
| 3387.983944 |
| 4743.33271 |
For Europe and North America the distribution of landmarks within 500km of each other is seen below. the data comes from a spreadsheet. it is seen that n. America has more landmarks close together than Europe. This maybe since the N. American landmarks are clustered on the East Coast, West cost and around Chicago. 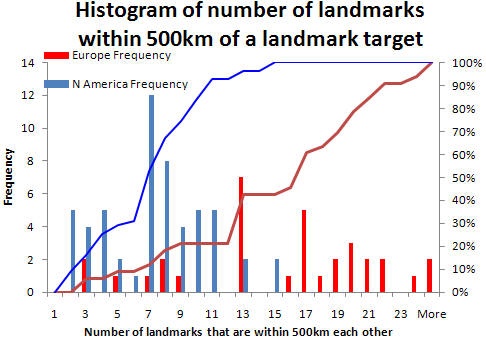
We also looked at the value of alpha to use in order to get the correct distance between the landmark and target target based on the measured minimum RTT. Histograms of these values is plotted below or N. America and Europe. 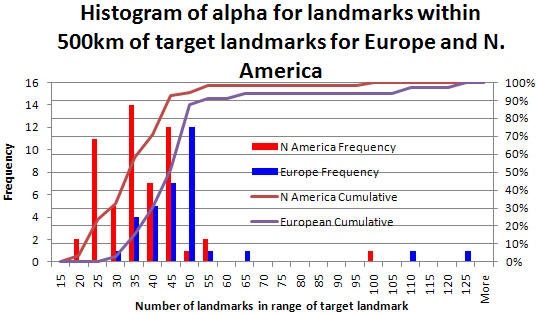
It is seen the the median alpha for N.america is ~ 0.35 while for Europe it is ~0.45.
Based on the above data, I plotted a graph to see the relationship between distance and error distance in a graphical manner. The graph is shown below:
...
This hypothesis is further strengthened and proved if we see the results in the attached sheet Analysis Results. It's clear from the result that for all those targets for which Error Distance is less than 1000Km, the MinRTT of the first selected landmark is less than even 60ms. This means that if for any target we are able to find a nearest landmark (with MinRTT<60), then we will be getting good results and smaller this minRTT is better are the results. From the attached results, we can also see that for all those targets for which we got error distance above 2000Km, the MinRTT (column D) was above 100ms.
From these results, we can roughly conclude that if we mange to have our landmarks distributed in the world in such a way that we get low MinRTT for any target, the error distance can drastically reduce.