Problem Statement:
Distribution of landmarks which are used in Apollonius and Trilateration is not even across the world. Most of the landmarks are located in Europe and North America and It was observed while running Apollonius tests that for Europe and North America, good results were shown by this geo location technique compared to other geographical regions like South Asia, Australia etc having less number of landmarks. Of course, one dominant reason was better and stable connectivity in Europe and North America but the impact of Landmark density on the Apollonius results was also worth considering and in this regard, I performed several tests to analyze the impact of Geographical distance of landmarks on the Error distance of apollonius.
Test Results:
Following table shows the average Geographical Error between landmarks in various regions and corresponding average error distance of Apollonius tests.
Region Name |
Average Geogrphical Distance (Km) |
Average Error Distance (Km) |
|---|---|---|
Europe |
555.6404153 |
478.828953 |
North America |
1756.877965 |
616.6994665 |
Latin America |
1790.503606 |
2513.449799 |
East Asia |
841.0220395 |
492.7105378 |
South Asia |
1006.405099 |
1162.08826 |
Africa |
3387.983944 |
1835.618196 |
Based on the above Data Following Graph shows the relationship between Geographic and Error Distance.
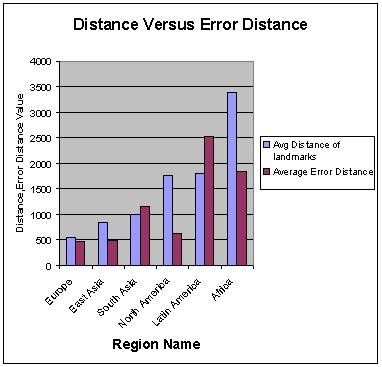
From the Graph, we can see that for Regions having a geographical distance of less than 1500Km, we are getting quite good results in the range of Less than 1000Km Error distance. From these results one can conclude that if we manage to get such a landmark distribution that the geographical distance between landmark is less than 1000Km (average), we can get quite acceptable and correct result estimates from apollonius.
The Revised Apollonius Results Sheet might indicate that with the current landmark distribution, if we want an average error of < 700km then we can support Europe, N. America and E. Asia.