...
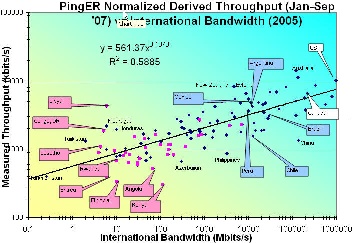
The figure below shows the correlation between International bandwidth Inn Figure 12) and the normalized derived PingER throughput. It can be seen that the correlation is good (R 2
~ 0.59). It is also seen that the African countries (in Magenta) lie towards the bottom left where both the throughput and International Bandwidth are low. Libya is an anomaly since the only site monitored there is the email server for the Libya Telecommunications which should have good connectivity compared to most sites in Libya.
To verify whether the order of magnitude of the normalized derived throughput is correct we compare it with the Speedtest results from www.zdnet.com.au/broadband/results.htm. This application sends a known amount of data between your computer and servers in Australia. Then it measures throughput and besides returning the result to the user, it also saves and makes available the results by country and ISP. The correlation is shown in the figure below. The orders of magnitude of the two methods agree and there is a strong correlation. As expected the African countries have the poorest results.
...