...
Drivers are for processing events one-by-one and doing some work on the data. This may include performing some physics analysis or creating plots. A driver can contain additional, "child" drivers, so the complexity of the processing algorithm can be segmented into several different logical functions.
| Tip | ||
|---|---|---|
If you want to load Drivers that are in packages, you have to choose
then you have to |
Opening the LCIO File
Start JAS3 and open the file from the LCSim Event Browser Tutorial using the File -> Open command. If (and only if) you have both the LCIO and the org.You should lcsim plugin installed, you will be asked which one to use. In this case select the org.lcsim plugin.
If you now see the record loop commands and the name of the file displayed in the record source drop-down box, the file is loaded OK.
Opening the Sample Driver
Open a sample driver by going to Help -> Examples and navigating to org.lcsim Examples. Click on Analysis101.java to load the sample driver in a new window.
...
Subsequent compiles of this file will cause the Driver to be automatically reloaded.
Processing Events
| The Go button processes all events until the end of the file |
| The Go 1 button processes only the next event |


To process some events using the loaded Driver, click on the Go button on the toolbar or press F5. This will run the Driver's process method over all the records in the LCIO file.
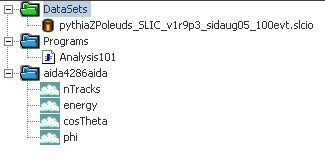
Once the processing is completed, expand all the folders on the JASTree menu.
You should then have something similar to this.
JASTree after Processing
Viewing Histograms
This particular example produces some histograms, which should be visible.
Explanation of Driver Code
Below is the complete text of the Analysis101 Driver, stripped of comments.
| No Format |
|---|
import org.lcsim.util.aida.AIDA;
import hep.physics.vec.VecOp;
import java.util.List;
import org.lcsim.event.EventHeader;
import org.lcsim.event.MCParticle;
import org.lcsim.util.Driver;

public class Analysis101 extends Driver
{
   private AIDA aida = AIDA.defaultInstance();

   protected void process(EventHeader event)
   {
      List<MCParticle> particles = event.get(MCParticle.class,event.MC_PARTICLES);

      aida.cloud1D("nTracks").fill(particles.size());

      for (MCParticle particle : particles)
      {
         aida.cloud1D("energy").fill(particle.getEnergy());
         aida.cloud1D("cosTheta").fill(VecOp.cosTheta(particle.getMomentum()));
         aida.cloud1D("phi").fill(VecOp.phi(particle.getMomentum()));
      }
   }
}
|
First, as in all Java programs, there are the import statements.
| No Format |
|---|
import org.lcsim.util.aida.AIDA;
import hep.physics.vec.VecOp;
import java.util.List;
import org.lcsim.event.EventHeader;
import org.lcsim.event.MCParticle;
import org.lcsim.util.Driver;
|
This includes code libraries into the Driver that are needed to do the analysis.
For instance, methods of org.lcsim.util.aida.AIDA are used to book and fill the plots.
The hep.physics.vec.VecOp package is for doing math operations on vectors.
Next is the declaration of the Driver class.
| No Format |
|---|
public class Analysis101 extends Driver
|
The Analysis101 class extends Driver, which means that it can override some or all of Driver's public or protected methods to do some useful work, like filling histograms.
The class stores a reference to the default AIDA object.
| No Format |
|---|
private AIDA aida = AIDA.defaultInstance();
|
This is convenient for creating and filling histograms "on-the-fly".
The single function in this class is called process. Analysis101 inherits this method from Driver.
| No Format |
|---|
protected void process(EventHeader event)
|
Its single argument is the EventHeader of the current LCIO event. All collections in this event are accessible through the EventHeader interface.
shown in the JASTree menu.
Try selecting the nTracks plot by double-clicking on its icon in the JASTree. The plot will be displayed in a new window.
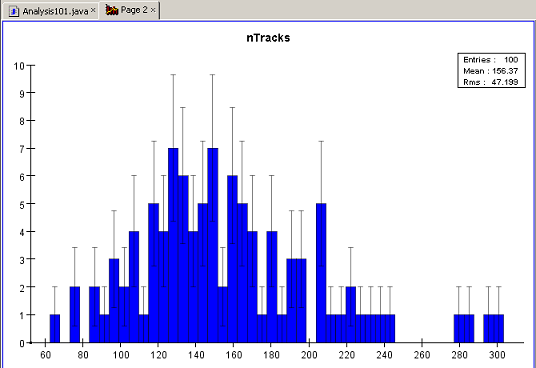
View any other plot by double-clicking its icon in a similar fashion.
You can save the current plot from the file menu (via Save As) and you can save the whole tree by right-clicking on the folder (aida4286aida in this example) and selecting "Save As"
...
| title | EventHeader API |
|---|
...
.