...
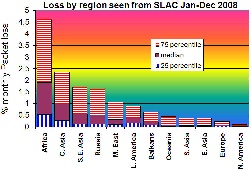
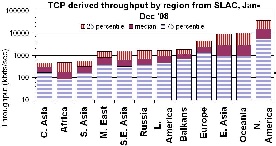
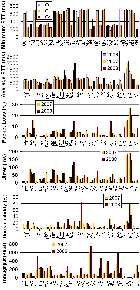
Loss variability | Throughput variability | Region to Country Throughputs | Region to Country Throughputs |
|---|---|---|---|
| | | |

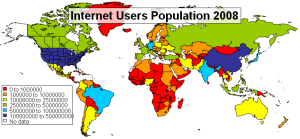
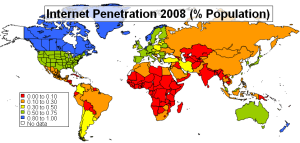
Internet Users Population 2008 | Internet Penetration 2008 (% Pop) |
|---|---|
| |
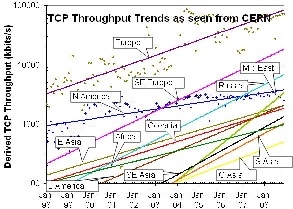
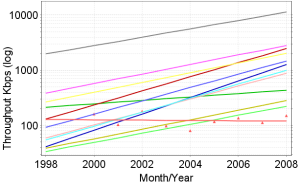
Trends
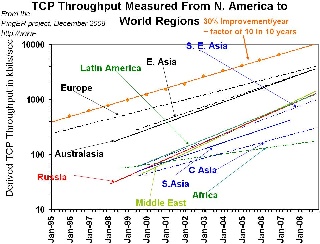
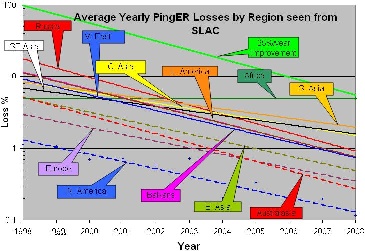
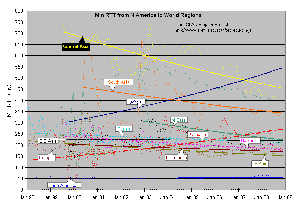
Throughput from SLAC | Loss from SLAC | Minimum RTT from SLAC | Throughput from CERN |
|---|---|---|---|
| | | |
...
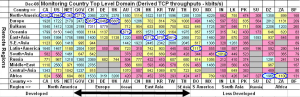
MinRTT, AvgRTT, Packet Loss, | Derived Throughput (Kbps) |
|---|---|
| |
...
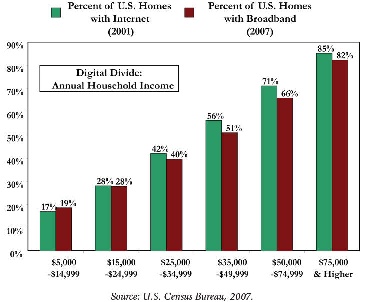
As seen below in the graph (from Down Payment on Our Digital Future ) of percent of US homes with the Internet in 2001 and Broadband in 2007 there is a economic digital divide.
A Typology of Information and Communication Technology Users
...
| Panel |
|---|
Some 15% of Americans have neither a cell phone nor internet access. They tend to be in their mid-60s, nearly three-fifths are women, and they have low levels of income and education. Although a few have computers or digital cameras, these items seem to be about moving digital information within the household - for example, using the computer to display digital photos that they take or others physically bring into the house. |
Presentations etc.
- "The Strategic importance and impact of e-infrastrucures for Science, Society and Economy in Europe and neighbouring Southern Countries", Robert Klapisch, EUMED 2008, Amman, Jordan 2008
- Digital Divide in Sub-Saharan African Universities: recommendations and monitoring, by B. Barry, M. Petitdidier, L. Cottrell, C. Barton for the IST-Africa conference and exhibition, May 07-09, 2008 Windhoek, Namibia.
- Internet Connectivity in Africa, presented by Les Cottrell at the Internet and Grids in Africa: An Asset from African Scientists for the Benefit of African Society, 10-12 December 2007, Montpellier France.
- January 2008 report of the ICFA-SCIC monitoring Working Group
- Telegography Telecoms International Workshop, Tim Stronge, Eric Schoonover at PTC'08 13-16 January 2008
- GLOBAL BANDWIDTH RESEARCH SERVICE EXECUTIVE SUMMARY, Telegeography
- "Spiralling bandwidth demands spur undersea cable deployment", Joel Hruska, ARSTechnica, July 2008
- "Internet-led demand puts cable-laying at top of list", Paul Yaylor, Financial Times July 8, 2008