We are interested in validating/comparing alternative ways of actively measuring the throughputs for countries of the world especially for developing countries. Part of this is to compare the results with those obtained from the PingER derived throughputs. with those obtained by the Ookla Speed test measurements. I We therefore contacted Ookla by email on November 27, 2007 and Mike Apgar and Doug Suttles of Ookla were kind enough to reply, answer questions, and on December 6, 2007 provide data suitable for importing into Excel (CSV format) and analyzing.
...
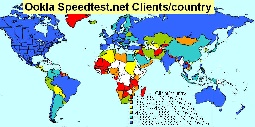
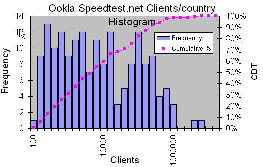
The US has the most IP addresses (clients) = 5.7M, followed by the UK (2.5M), Canada(890K), Germany(84-K), Italy(835K), Australia(607K), Poland(556K), Mexico(481K), Russia(442K). A map of Clients/country is shown below. The lowest number of clients/country are French Polynesia(100), Greenland(102), Zambia(106), Burkina Faso(107), Haiti (108), Madagaskar(118), Northern Mariana Islands(121), Belize(130), Mali(146), Mauritania(149). A frequency histogram (with logarithmic bin widths) of clients/country is shown to the right. the relative flatness of the distribution (with logarithmic bins) indicates that the fall off in clients/country is exponential in nature.
Clients per country Map | Clients per country Histogram |
|---|---|
| |
Highest The highest download speed is Japan=11Mbits/s, followed by Sweden, Latvia, Romania, Netherlands, Bulgaria, Singapore, Germany, France, US. Slowest download speed is Cameroon (199kbits/s) followed by Mauritius, Botswana, Angola, Madagascar, Nepal, French Polynesia, New Caledonia, Tanzania, Kenya (i.e. bottom 5 in Africa). Fastest upload is Japan (5.1Mbits/s) followed by Russia, Romania, Sweden, Bulgaria, Latvia, Hong Kong, Lithuania, S. Korea, Moldova. The large number of Eastern European countries is interesting and not understood. The slowest download speeds are Madagascar (70kbits/s), followed by Yemen, Angola, Cameroon, New Caledonia, Botswana, Uruguay, Nepal, Zambia, French Polynesia (276 kbits/s). 50% of the slowest 10 download speed countries are in Africa.The median upload speed (303kbis/s) is 1/3 of the median download speed. Currently the African representation by country is only 26 (out of I think 54). It will be interesting to see if this improves as more measurements are made.
A map of the Ookla download and upload throughputs measured for clients in the various countries of the world is shown below. The poor coverage for Sub-Saharan Africa (there was no data for countries in white) is seen as is the much better performance for developed regions such as N. America, Europe, Japan and Australaisia compared to developing regions. Also on the right we show a map of the ratios for upload/download.
...