Page History
...
- Look on main hutch grafana page at upstream-link-status graph
- ssh mcclogin (Ken Brobeck should be contacted to get access, in particular may need access to softegr account).
- ssh softegr@lcls-srv01 (Matt chooses "user 0")
- look at fanouts that are upstream of xpm:0. three layers to get all the way back to the source (the TPG which runs the whole accelerator, has a clock input from master source. clock could conceivably go away). See below for example of this working on rix-daq. Moving upstream:
- caget TPF:LTU0:1:RXLNKUP (immediately upstream)
- caget TPF:IN20:1:RXLNKUP
- caget TPF:GUNB:1:RXLNKUP (fanout that TPG drives)
- caget TPG:SYS0:1:TS (prints out timestamp from TPG, which is a check to see that TPG is running)
- caget TPG:SYS0:1:COUNTBRT (should be 910000 always)
- PERHAPS MORE USEFUL? to determine if problem is on accelerator side: look at the active fanout upstream of xpm0 (in building 5): TPF:LTU0:1:CH14_RXERRCNTS TPF:LTU0:1:FIDCNTDIFF (should be 929kHz) AND TPF:LTU0:1:CH0_PWRLNK.VALB (optical power in to the fanout).
- to see history run "lclshome" on machines like lcls-srv01: exposes archiver on the right hand side (see picture in LCLS1 section above). NOTE: Remember to click "PLOT" in the middle of the right side of the archive viewer. see MCCEpicsArchiverAccess for a video on how to access the MCC epics archiver
...
Can also look for errors from lclshome: select "SC" (top left) "Global" (left of top row) and "Event" (middle of left column) then "Expert Display" on upper right:
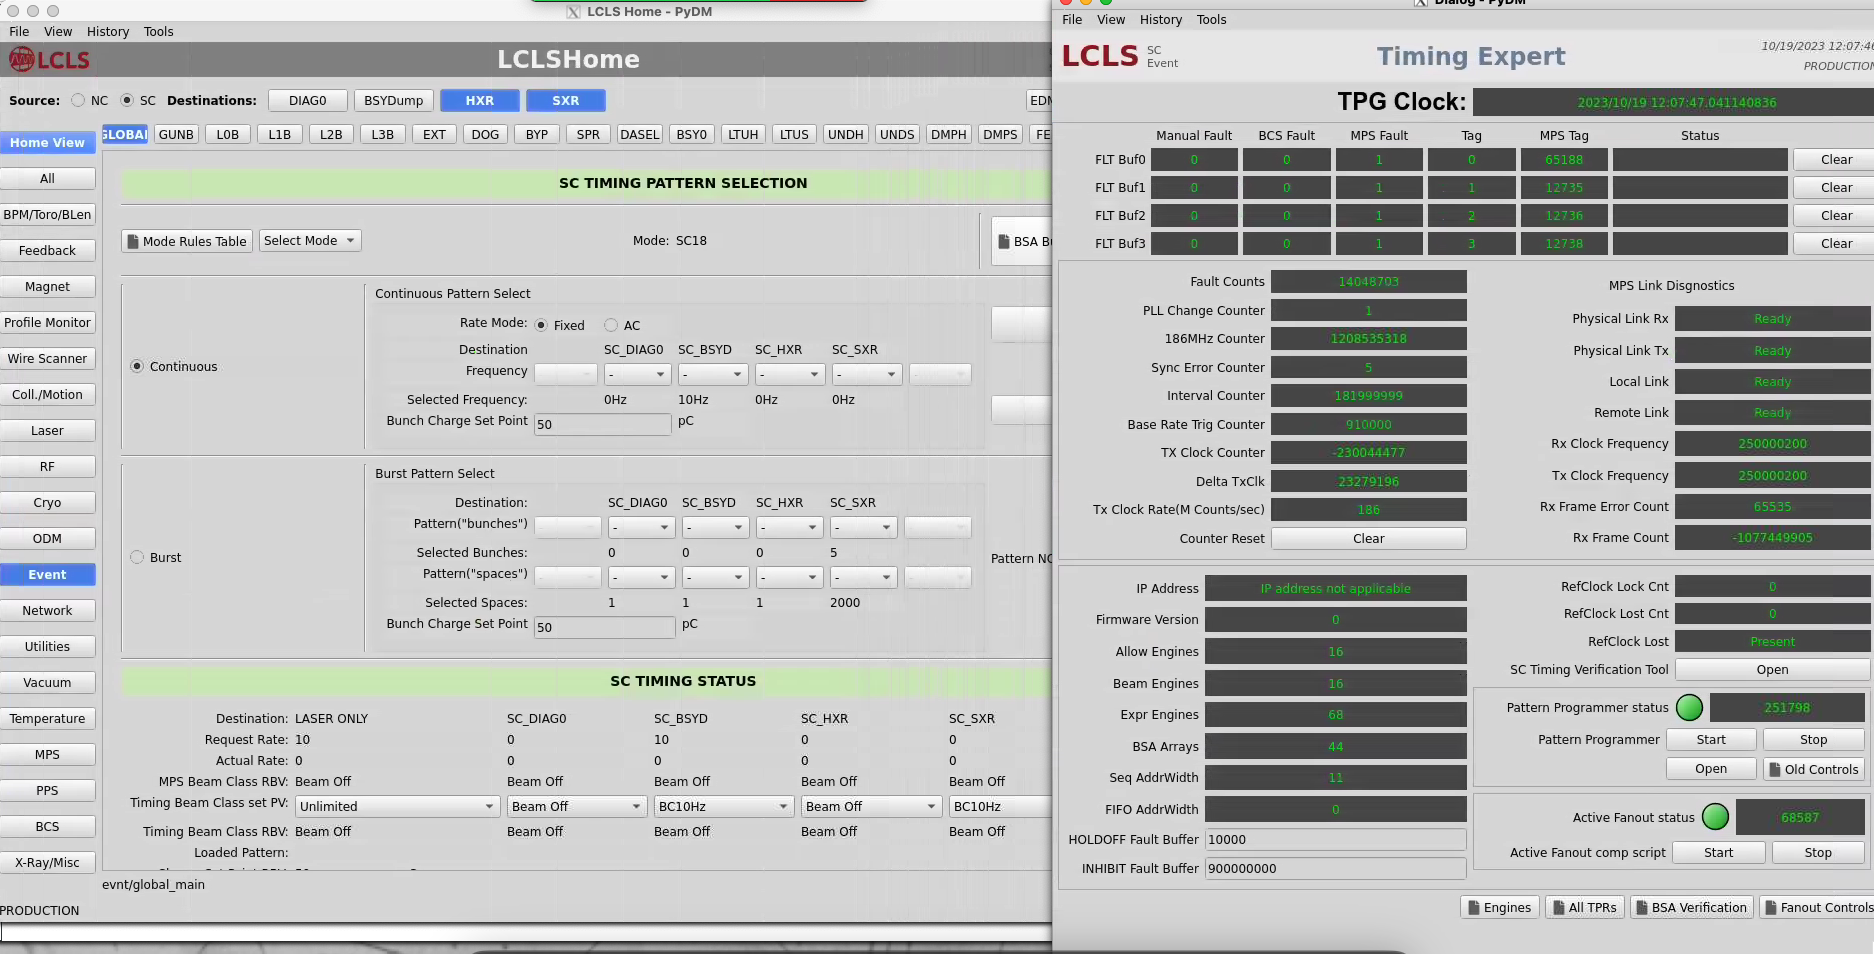
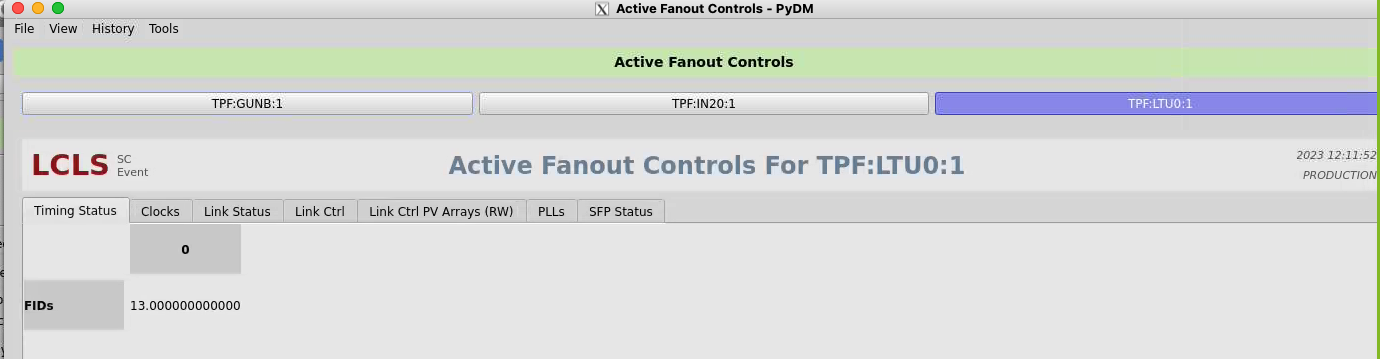
Click on "fanout controls" in lower right. Select "TPF:LTU0:1", on the "Timing Status" tab expect to see 929kHz of "fiducials". This shows an error condition:
The "Link Status" tab rxErrCnts value should be zero (especially for the "In" at the bottom line):. This shows an error condition.
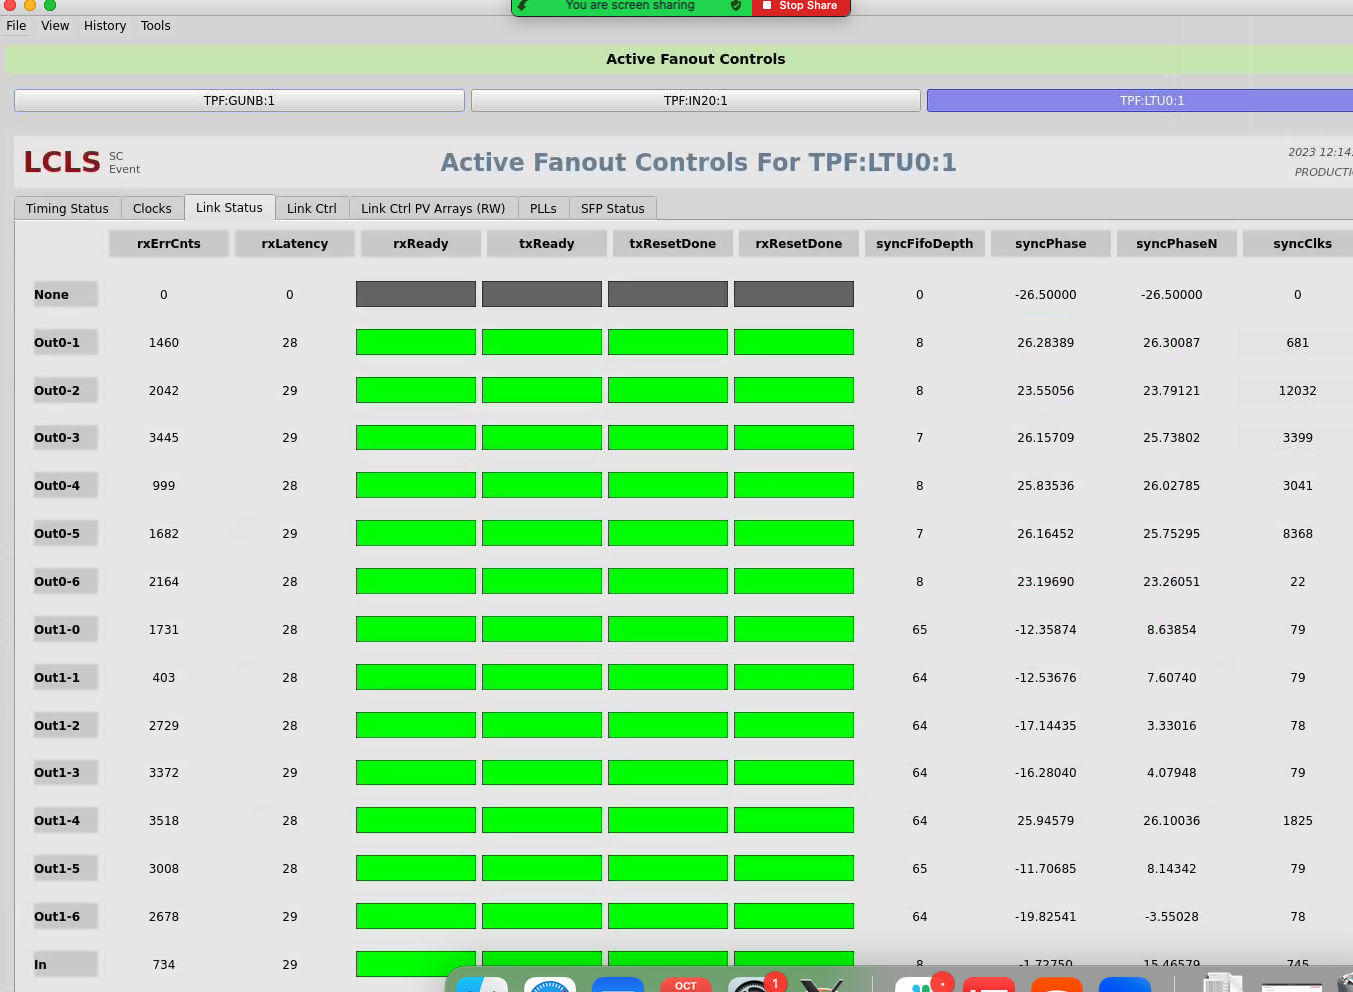
One of these "outs" goes to a local fanout in 208, which then drives xpm0.
...
Overview
Content Tools