...
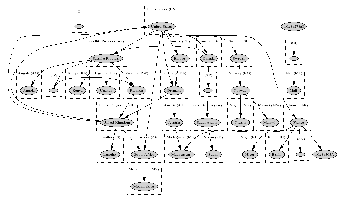
Generated by: PingER Route Visualizer
As seen from SLAC,
USA (raw-data)
| As seen from SEECS/NUST NCP
Pakistan, South Asia (raw-data) | As seen from ICTP
Italy, Europe (raw-data)
|
|---|
| 
| 
|
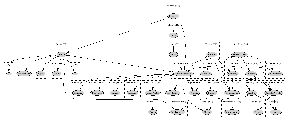
As seen from Bolivia,
Latin America (raw-data) | As seen from OUAGA,
Burkina Faso (raw-data) | As seen from TWAREN,
Taiwan (raw-data) |
|---|
| 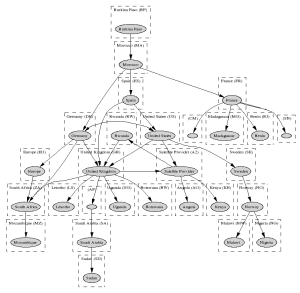 | 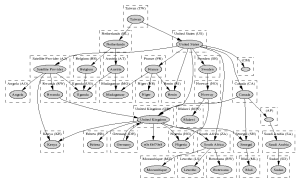 |
As seen from AARNET,
Australia (raw-data) | As seen from KHU
South Korea (raw-data) | As seen from ACMESECURITY
Brazil |
|---|
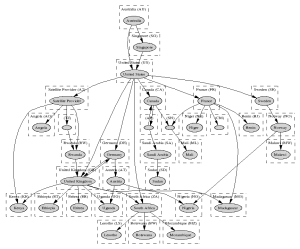 |  | 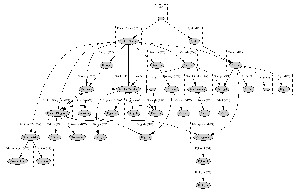 |
The same information is available in tabular format. We derive the following conclusions from the traceroute tests:
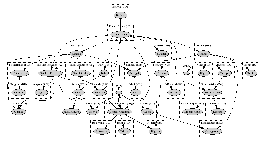
PingER Performance Metrics
MinRTT, AvgRTT, Packet Loss,
Jitter and Ping Unreachability
2007 and 2008
(raw data)
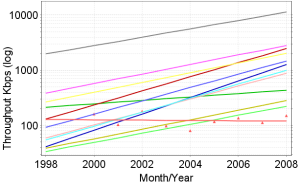
| Derived Throughput (Kbps)
to the world as seen from
SLAC since 1998
(graphs)
|
|---|
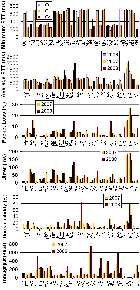 | 
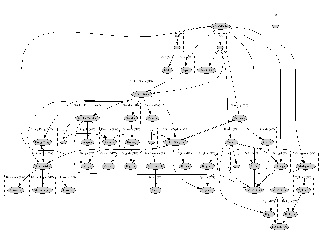
<ac:structured-macro ac:name="unmigrated-wiki-markup" ac:schema-version="1" ac:macro-id="2d7478b1f96b53b2-4bca6548-4b8744bd-a21e8173-77b5013cf8bfd0aa836aa309"><ac:plain-text-body><![CDATA[[Red: Africa, Light-blue: Balkans, Light-green: Central Asia,
]]></ac:plain-text-body></ac:structured-macro>
Yellow: East Asia, Pink: Europe, Light-blue: Latin America,
Orange: Middle East, Grey: North America, Maroon: Oceania,
Royal-blue: Russia, Dark-green: S.E. Asia, Mustard: S. Asia,
Red-triangles: Africa - measurement points]
|
...