...
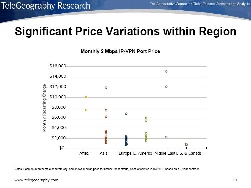
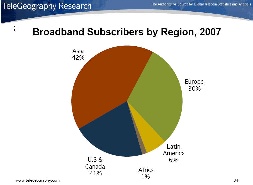
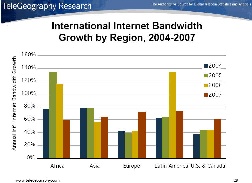
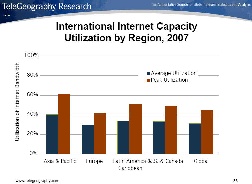
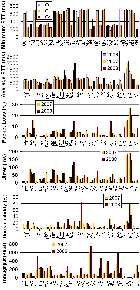
Inter Regional Traffic | Price Variation | Subscribers | Growth by Region | Utilization of Available Bandwidth |
|---|---|---|---|---|
| | | | |

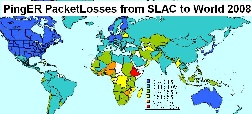
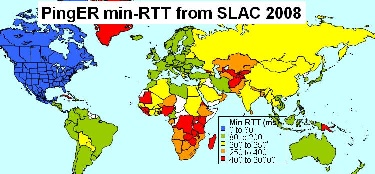
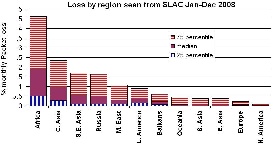
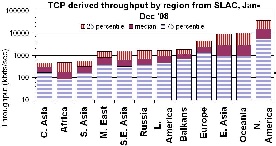
Loss Map | Min-RTT Map | Loss variability | Throughput variability |
|---|---|---|---|
| | | |
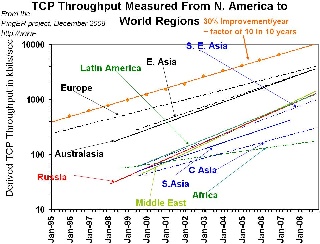
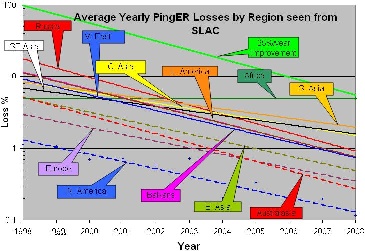
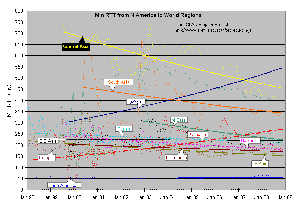
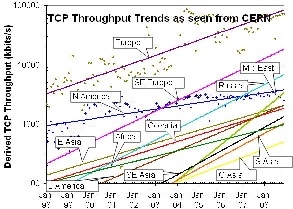
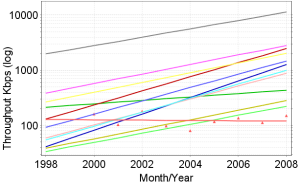
Trends
Throughput from SLAC | Loss from SLAC | Minimum RTT from SLAC | Throughput from CERN |
|---|---|---|---|
| | | |
...
MinRTT, AvgRTT, Packet Loss, | Derived Throughput (Kbps) |
|---|---|
| |
...