...
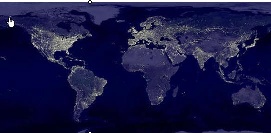
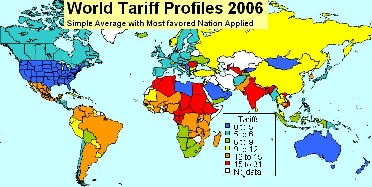
Figure 4: World light at night | Figure 5: World Tariff Profiles | Figure 6: |
|---|---|---|
| | |
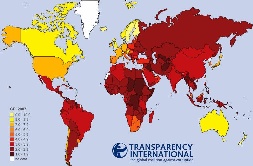
Figure 7: HIV Prevalence | Figure 8: Corruption Perception Index | Figure 9: |
| | |
|
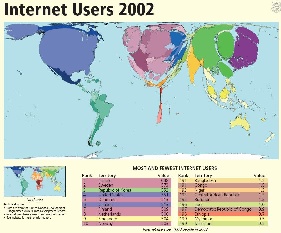
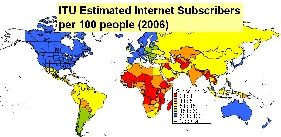
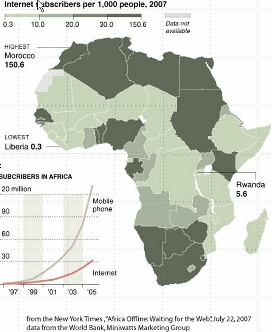
Another way of looking at the poor situation in Africa is to look at Figure 1011, illustrating the lack of Internet users in Africa compared to the rest of the world. At the bottom left of figure 10c 11c is shown the growth of Internet users and cell phone subscribers. This may suggest that cell phone infrastructure may be a very valuable way to leverage Internet growth.
Figure 10a11a: | Figure 10b11b: | Figure 10c11c: |
|---|---|---|
| | |
Capacity
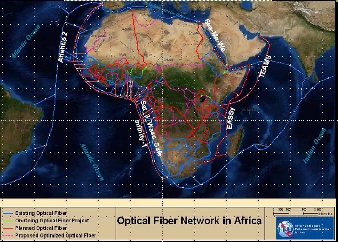
International capacity to African countries is mainly provided via satellite or via fibre links. Satellite links are not only much more expensive (300-1000 times) in terms of $/Mbps but they also induce long delays of over 400mseconds that result in lack of interactivity and poor performance. However in 2004 only 14 of 49 sub-Saharan countries had access to fibre according to NEPAD. In fact as seen in Figure 1112:
Figure 1112: Fibre links to and within Africa and the locations of universities | Figure 1213: |
|---|---|
| |
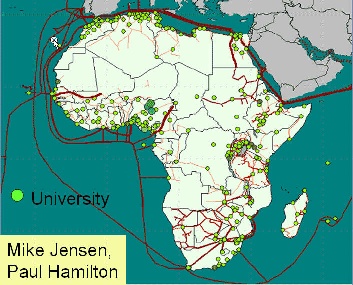
There is only one large-scale intercontinental fiber link to Sub-Saharan Africa (SAT-3/WASC/SAFE) which provides connections to Europe (via Portugal) and the Far East for eight countries (Senegal, Ivory Coast, Ghana, Benin, Nigeria, Cameroon, Gabon and Angola) along the West Coast of the Continent and south to the Cape in South Africa. A second segment, in the Indian Ocean, connects South Africa to Malaysia while passing through Mauritius and India (SAFE). Jointly funded by 36 members and spearheaded by South African Telkom which invested US$85 million for a 13 per cent stake, the project cost about US$650 million dollars. The ownership of the cable was established as a club consortium, which is a confidential shareholder agreement about which little is known (despite efforts by the South African government to release the details). The cable was expected to lead to much reduced international bandwidth costs, but so far this has not occurred due to the business models used to develop the project. Even the few countries that have access to international fiber through SAT-3 are not seeing the benefits because it is operated as a consortium where connections are charged at monopoly prices by the state owned operators which still predominate in most of Africa, and in many other developing regions. Landlocked African operators who have tried to purchase international fibre capacity directly from one of the consortium's international members have found themselves being charged as much to reach the SAT-3 landing point as they were charged to get from the landing station to Portugal. Sadly, the high costs have made it cheaper to send the traffic directly by satellite, even for SAT-3 shareholders such as Telecom Namibia, which has no landing point of its own. Except for some onward links from South Africa to its neighbors, and from Sudan to Egypt and from Senegal to Mali, the remaining 33 African countries are unconnected to the global optical backbones, and depend on the much more limited and high-cost bandwidth from satellite links.
Mike Jensen
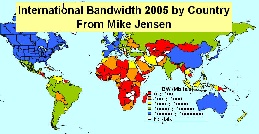
In fact SAT-3 prices have barely come down since it began operating in 2002 and are sold at satellite prices of $4-8K/Mbps/mo even though the capacity is only 5% used. As a result the lack of fiber and lack of competition on SAT-3, international bandwidth to African countries, as seen in Figure 12 13 lags well behind most of the rest of the world.
...
| Wiki Markup |
|---|
One result and immediate cause of this is the cost of Internet connections in Africa and how they relate to income (Compare Figure 13a14a and 13b14b) and affordability. For example "Currently \[2007\] prices on SAT-3 are up to US$15,000 / Mbps/month, while it is estimated to cost the consortium only about US$300/Mbps/month". From a posting by Dewayne Hendricks on Dave Farber's Iper list \-\- Bill St Arnaud. Figure 13c14c (from Mike Jensen) shows the GDP per capita in 2006. |
Figure 13a14a: 2002 | Figure 13b14b: | Figure 13c14c: GDP/capita for 2006 |
|---|---|---|
| |
|
Market Research conducted by Paul Budde Communications indicates that 1 year of Internet access is greater than the annual income of most Africans. Only in Egypt, Libya, and Mauritius is the annual cost of Internet access < 10% of the annual income. A study on Promoting African Research & Education Networking (PAREN), sponsored by IDRC, in Jan 2005 showed that African universities pay on average 50 times more for bandwidth than, for example, U.S. universities ($5.46/ Kbps/month vs. $0.12/Kbps/month). W. Africa pays on average $8/Kbps/month, and N Africa $0.52/Kbps/month. An OECD study on Broadband in November 2007 showed a median for OECD countries of $16/Mbps/month with Japan at $3.09/Mbps/month. Even a recent Bandwidth Initiative by a c alition of 11 African Universities (MZ, TZ, UG, GH, NG, KY) + four major US Foundations to provide satellite through Intelsat though it reduced the costs by a factor of three they are still at $2.23K/Mbps/month. Thus Africans are paying hundreds of times what is being paid by residences in OECD countries.
...
At the same time there are promises of considerably increased fibre connectivity to sub-Saharan Africa, see figure 1415. In fact, four major undersea cable projects are currently engaged in a race to be the first to lay a fibre-optic link connecting the eastern seaboard of Africa to the rest of the world, with the most vicious competition centering on the connections to Europe, which is the destination for 85 per cent of international bandwidth traffic in Africa. The four projects are the East African Submarine Cable System (Eassy), Seacom, TEAMS and Reliance of India. The goal is to have these cables in place in time for the Soccer World Cup in South Africa in 2010.
Figure 1415: |
|
|---|---|
|
GEANT has connections to EuMed in particular Marocco, Algeria, Tunisa and Egypt, see http://www.dante.net/upload/pdf/EUMED-poster.pdf . They are now working on connecting to Ubuntunet East and Ubuntunet South.
...
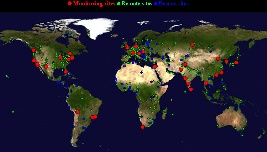
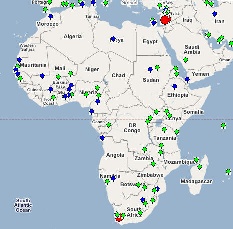
The PingER project is arguably the most extensive active end-to-end Internet performance measurement project today. Its data goes back over a decade and more recently has focused on measuring the Digital Divide. It covers measurements from over 16 countries to over 150 countries (see Figure 1516) containing over 99% of the world's Internet connected population. 45 of the countries are in Africa.
Figure 15a16a: PingER Deployment Dec 2007, red are monitoring sites, blue beacons that are monitored from most monitoring sites and green the monitored only sites. | Figure 15b16b: Google map of African sites Dec 07 |
|
|---|---|---|
| |
...