...
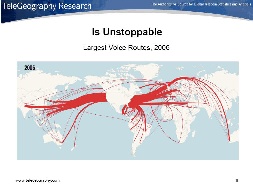
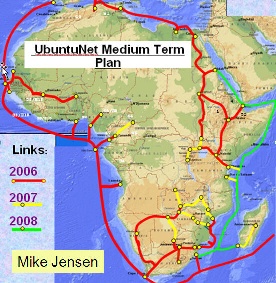
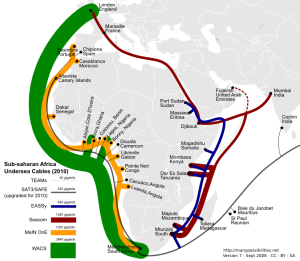
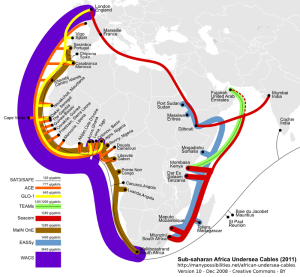
Voice Routes 1997 | Voice Routes 2007 | World Cables 2007 | Africa Cables 2006-2008 Plans |
|---|---|---|---|
| | | |


(c) manypossibilities.net - current | (c) manypossibilities.net - current | |||||
|---|---|---|---|---|---|---|
| | | | | | |
Satellite vs Fibre
Satellite is extremely effective in reaching places where the volume of traffic would not justify a fibre connection. Satellite providers are reluctant to talk about prices (except directly with their customers) because it is often difficult to explain to new customers that the lowest prices are only available to large customers with long contracts. However, if pressed satellite operators will say that below US$1800-2000 per mbps per month is not likely to be commercially feasible for them. (See Fibre for Africa).
Satellite networks are often severely bandwidth-constrained and possess high latency. Links may be as narrow as 64K and possess latencies of 250, 500, 750 milliseconds or more. This combination of conditions often leads to congested satellite connections and performance so poor that applications frequently time out. One can attempt to address the delays by improving TCP by increasing buffer sizes to accomodate the long delays), modifying its congestion algorithm. One can also compress data and/or use streaming.
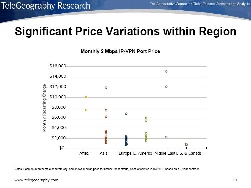
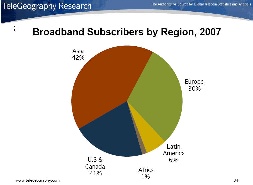
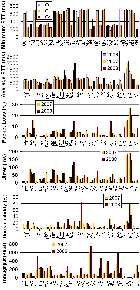
Regional Comparisons
Inter Regional Traffic | Price Variation | Subscribers |
|---|---|---|
| | |

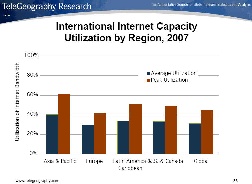
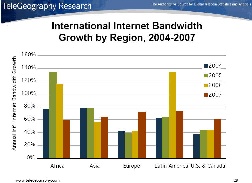
Utilization of Available Bandwidth | Growth by Region |
|---|---|
| |
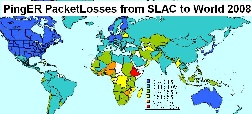
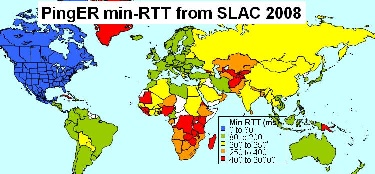
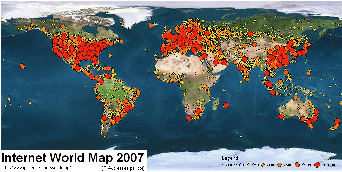
Loss Map | Min-RTT Map | Internet World Map '07 | Areas |
|---|---|---|---|
| | | |

Cell Phones vs internet
Despite efforts to provide high-speed Internet Africa is falling behindthe rest of the world. Due to lack of infrastructure many African countries concentrate on mobile phones. Hoever, this does not necessarily remove the need for bandwidth for as quoted by Network World 2/11/2009:
Cisco says the advent of smartphones and laptops with 3G aircards will lead to an explosion of mobile data traffic over the next five years, as an iPhone typically generates 30 times the mobile data traffic of a basic-feature phone, while a laptop generates 450 times the mobile data traffic as a basic-feature phone. A recent study by mobile browser developer Opera Software showed that data traffic sent to mobile phones jumped 463% in November 2008 as compared with November 2007, and that page views on mobile devices were up by 303% over the same period. Thus the need for bandwidth continues even wit just mobile phones.
Complex mobile applications, such as telemedicine, interactive gaming and mobile education systems, won't be realistically available until carriers begin launching more of their 4G network offerings next decade.
Further (from "Global Market Brief: Communications Inftastructure for the Developing World" Stratfor, 2/21/2008):
While mobile phone infrastructure is cheaper to construct, the fiber-optic lines are what attracts long-term investment from the business community, which needs dependable, high-speed and high-data-throughput telecommunications infrastructure at a globally competitive price. Consumer products businesses also see growth in the southern African region in offering high-tech, high-bandwidth products such as high-definition television, peer-to-peer file sharing and Internet TV.
Between 1999 and 2004, the number of cell phone subscribers in Africa jumped from 7.5 million to 76.8 million (translating to about one in 11 Africans having a cell phone), and one-fifth of these subscribers live in South Africa. The market grew about 58 percent annually during that time period, compared with the Asian market, which grew at about 34 percent annually during the same amount of time.
However from http://blog.ted.com/2007/07/incremental_inf.php
You can build a mobile phone network one piece at a time. With a GSM license and a single tower, a company can begin earning revenue and start using this revenue to finance future expansion. An investment in the single-digit millions can turn into a multi-billion dollar business through reinvestment of revenues. That just isn't true for creating container ports, major roads or large power generating facilities (...)
And from http://www.mbendi.com/indy/cotl/af/p0005.htm:
The world might be in recession but the African telecommunications sector continues to boom, fuelled by privatisations, liberalisation, new cell-phone services and infrastructure projects - some funded by the World Bank, African Development Bank and other agencies, but more funded by innovative entrepreneurs in partnership with international telecoms companies.
Although cable connections across many African countries are in a poor state of repair or non-existent, the continent is slowly being connected to the global community through five undersea cable projects, three of which are due for completion in 2009.
The African cell-phone sector is the fastest growing in the world, with subscription growth between 2007 and 2008 at 41% annually. Cell phones currently account for 90% of telephone subscribers in Africa. At the beginning of 2008, there were 300 million mobile subscribers on the continent.
Also in the developing world, said Mongi Hamdi, Head of the Science, Technology and Internet and Communications Technology branch of the United Nations Conference on Trade and Development:
"there are now estimated to be eight times as many mobile phones as fixed lines, three times as many mobile phones as personal computers, and nearly twice as many mobile phones as TV sets."
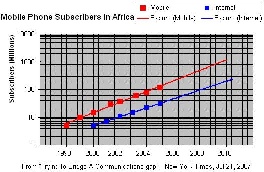
Taking the figures in http://www.nytimes.com/imagepages/2007/07/21/business/22rwanda_graphic.html and assigning values by eye one can plot them as seen below. There it is seen that Mobile penetration is about three times as great as Internet penetration, they are both growing at roughly the same rate, and Internet penetration is about 4 years behind the Mobile penetration.
Mobile vs Internet Subscribers for Africa |
|---|
|
Regional Comparisons
Inter Regional Traffic | Price Variation | Subscribers |
|---|---|---|
| | |
Utilization of Available Bandwidth | Growth by Region | |
|---|---|---|
| | |
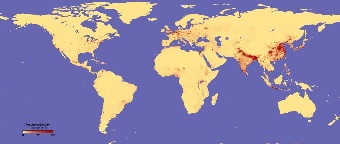
Loss Map | Min-RTT Map | Internet World Map '07 | Population Density people/sq-km | Areas |
|---|---|---|---|---|
| | | | |
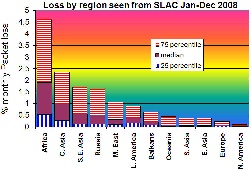
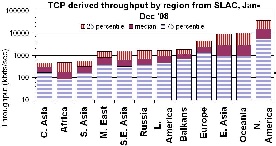
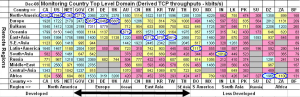
Loss variability | Throughput variability | Region to Country Throughputs | Region to Country Throughputs |
|---|---|---|---|
| | | |

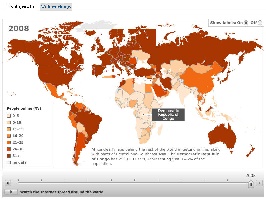
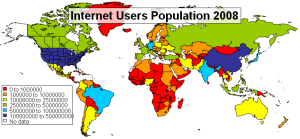
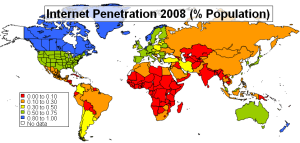
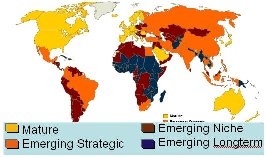
Given the saturation of many developed markets there is considerable attraction to exploring emerging markets, especially those with young populations.
Internet Users Population 2008 | Internet Penetration 2008 (% Pop) | Emerging Markets (Vital Wave) | Population Age |
|---|---|---|---|
| | | |
Loss variability | Throughput variability | ||
| |
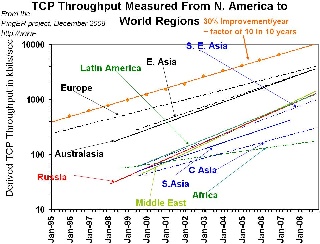
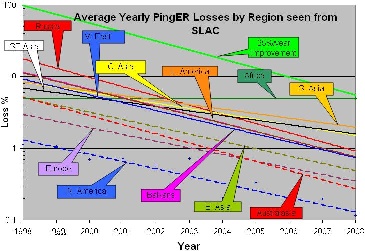
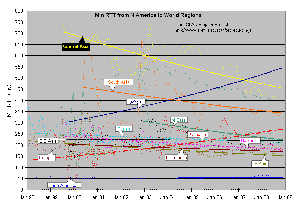
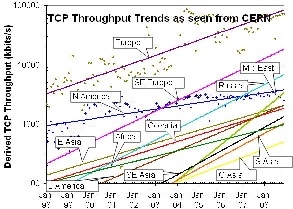
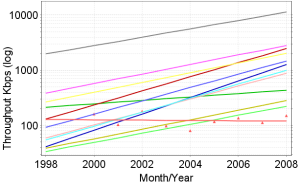
Trends
Throughput from SLAC | Loss from SLAC | Minimum RTT from SLAC | Throughput from CERN |
|---|---|---|---|
| | | |
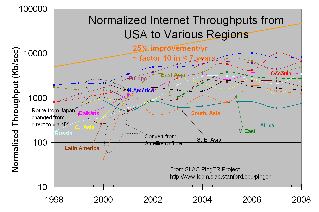
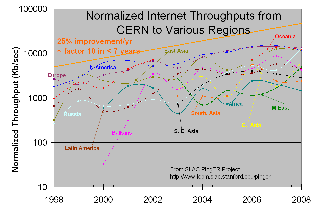
Normalized Throughput as | Normalized Throughput as |
|---|---|
| |
Cell Phones
Miscellaneous Statistics
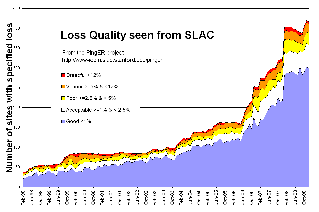
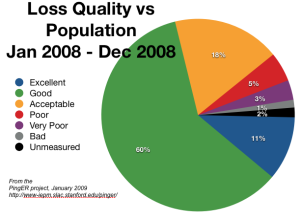
Loss Quality as seen from SLAC | Loss Quality vs Population |
|---|---|
| |
...
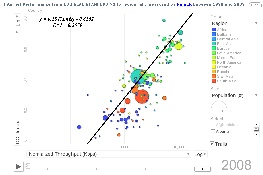
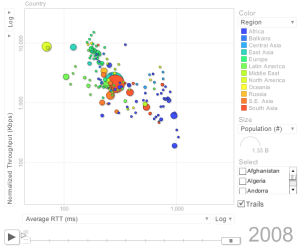
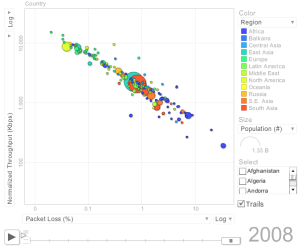
MinRTT, AvgRTT, Packet Loss, | Derived Throughput (Kbps) | ||
|---|---|---|---|
| | | |
...
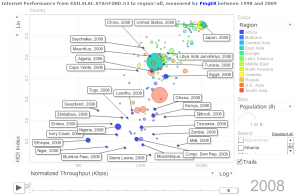
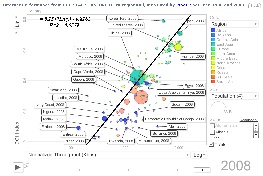
Normalized Throughput VS HDI | Normalized Throughput VS HDI | Normalized Throughput VS HDI | Normalized Throughput VS HDI |
|---|---|---|---|
| | | |
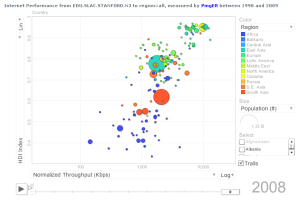
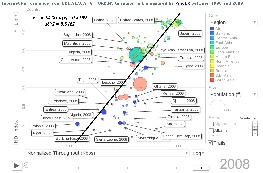

Normalized Throughput VS DOI | Normalized Throughput VS DOI | Normalized Throughput VS DOI | Normalized Throughput VS DOI |
|---|---|---|---|
| | | |
Motion Chart | Motion Chart |
|---|---|
| |
...
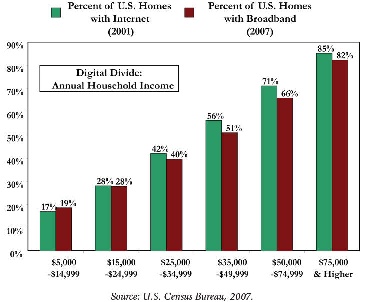
As seen below in the graph (from Down Payment on Our Digital Future ) of percent of US homes with the Internet in 2001 and Broadband in 2007 there is a economic digital divide.
A Typology of Information and Communication Technology Users
...
| Panel |
|---|
Some 15% of Americans have neither a cell phone nor internet access. They tend to be in their mid-60s, nearly three-fifths are women, and they have low levels of income and education. Although a few have computers or digital cameras, these items seem to be about moving digital information within the household - for example, using the computer to display digital photos that they take or others physically bring into the house. |
Presentations etc.
- "The Strategic importance and impact of e-infrastrucures for Science, Society and Economy in Europe and neighbouring Southern Countries", Robert Klapisch, EUMED 2008, Amman, Jordan 2008
- Digital Divide in Sub-Saharan African Universities: recommendations and monitoring, by B. Barry, M. Petitdidier, L. Cottrell, C. Barton for the IST-Africa conference and exhibition, May 07-09, 2008 Windhoek, Namibia.
- Internet Connectivity in Africa, presented by Les Cottrell at the Internet and Grids in Africa: An Asset from African Scientists for the Benefit of African Society, 10-12 December 2007, Montpellier France.
- January 2008 report of the ICFA-SCIC monitoring Working Group
- Telegography Telecoms International Workshop, Tim Stronge, Eric Schoonover at PTC'08 13-16 January 2008
- GLOBAL BANDWIDTH RESEARCH SERVICE EXECUTIVE SUMMARY, Telegeography
- "Spiralling bandwidth demands spur undersea cable deployment", Joel Hruska, ARSTechnica, July 2008
- "Internet-led demand puts cable-laying at top of list", Paul Yaylor, Financial Times July 8, 2008
- "Emerging Markets Definition and World Market Segments ", Vital wave, 2009.