Page History
...
It is always a good idea for the people doing analysis to be able to look at their detector images and be able to probe intensity values. Given that a typical LCLS experiment has millions of snapshots to choose from, it is also critical that you can quickly select images of interest and set regions of interest using masks. By the end of this tutorial, you will be able to browse images, jump to images of interest, generate masks, find peaks in your images, index crystal diffraction patterns, and change the x,y,z positions of your detector, find peaks in your images and index crystal diffraction patterns.
| Table of Contents |
|---|
| Code Block | ||
|---|---|---|
| ||
Citation for psocake (and other psana-based programs):
@Article{Thayer2017,
author="Thayer, J. and Damiani, D. and Ford, C. and Dubrovin, M. and Gaponenko, I. and O'Grady, C. P. and Kroeger, W. and Pines, J. and Lane, T. J. and Salnikov, A. and Schneider, D. and Tookey, T. and Weaver, M. and Yoon, C. H. and Perazzo, A.",
title="Data systems for the Linac coherent light source",
journal="Advanced Structural and Chemical Imaging",
year="2017", month="Jan", day="14", volume="3", number="1", pages="3", issn="2198-0926",
doi="10.1186/s40679-016-0037-7", url="https://doi.org/10.1186/s40679-016-0037-7"}

@article{Damiani:zw5004,
author = "Damiani, D. and Dubrovin, M. and Gaponenko, I. and Kroeger, W. and Lane, T. J. and Mitra, A.
and O'Grady, C. P. and Salnikov, A. and Sanchez-Gonzalez, A. and Schneider, D. and Yoon, C. H.",
title = "{Linac Coherent Light Source data analysis using {it psana}}",
journal = "Journal of Applied Crystallography",
year = "2016", volume = "49", number = "2", pages = "672--679", month = "Apr",
doi = {10.1107/S1600576716004349}, url = {http://dx.doi.org/10.1107/S1600576716004349}, } |
...
results (or res): This is the results directory which is backed up on tape. After completing your analysis, your results/data should be moved here.
Browse images
Let's learn how to display images and read pixel values.
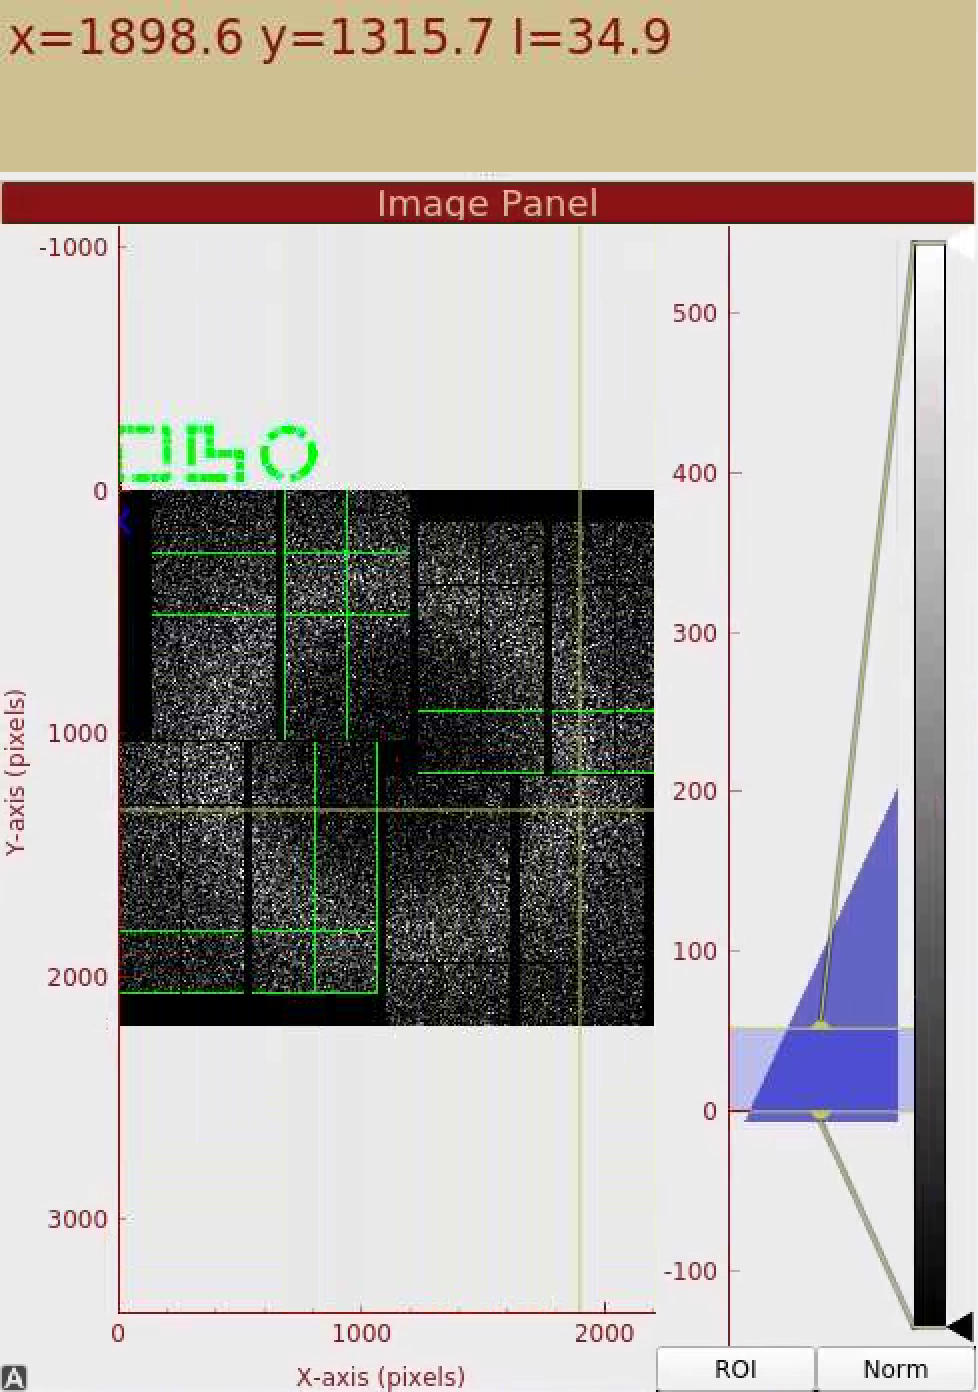
The Image Panel displays the gain-corrected image. The dynamic range for the display can be adjusted by dragging the two horizontal yellow bars on the intensity histogram on the right. By mousing over the detector pixels, the x,y position and pixel value are displayed above the panel.
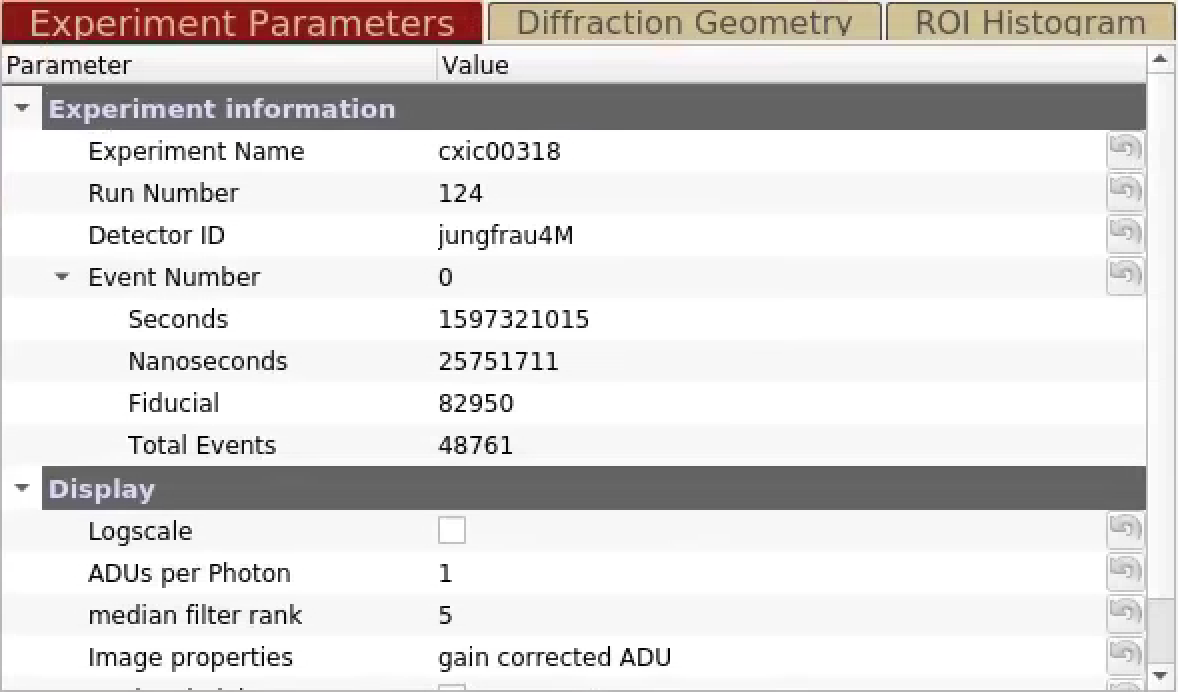
The Experiment Parameters Panel shows which detector image is being displayed. You can type in an event number in the "Event Number" field to display the image.
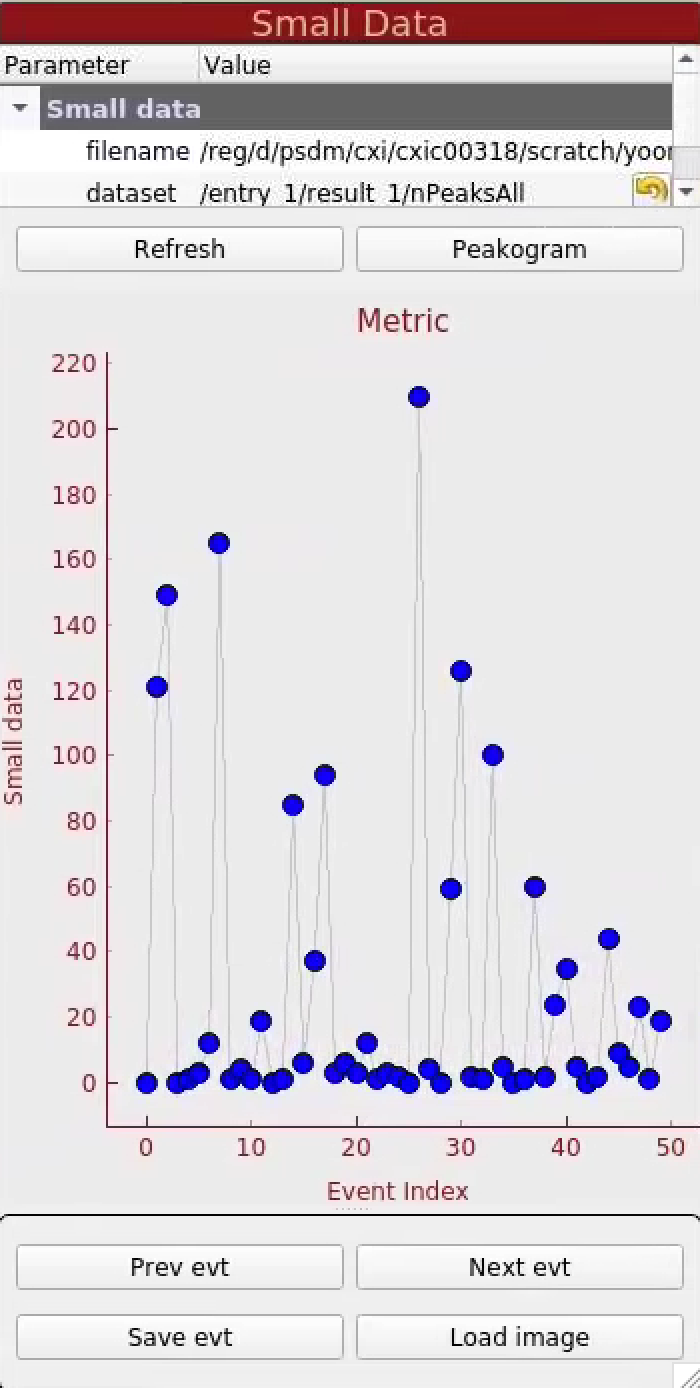
There are also "Prev evt" and "Next evt" buttons to decrease and increase the event number, respectively. These are located in the lower right corner of the GUI. If you have already ran the peak finder for this run, you will see a blue scatter plot of the number of peaks found for each event. The markers on the scatter plot are clickable and will update the event number and the detector image.
Mask making
In this section, let's learn how to mask out pixels that should not be used for analysis (such as dead pixels), mask out the jet streak at the centre of the detector, and mask out the water ring (just for fun!).
...
Overview
Content Tools