...
| Wiki Markup |
|---|
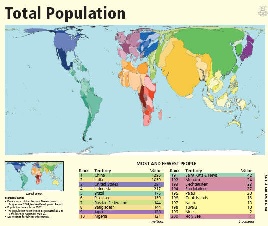
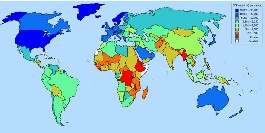
One result and immediate cause of this is the cost of this are costs of Internet connections in Africa and how they relate to income (Compare Figure 13a and 13b) and affordability. For example "Currently \[2007\] prices on SAT-3 are up to US$15 000 / Mbps/month, while it is estimated to cost the consortium only about US$300/Mbps/month". From a posting by Dewayne Hendricks on Dave Farber's Iper list \-\- Bill St Arnaud. Figure 13c (from Mike Jensen) shows the GDP per capita in 2006. |
Figure 13a: 2002 | Figure 13b: | Figure 13c: GDP/capita for 2006 |
|---|---|---|
| |
|
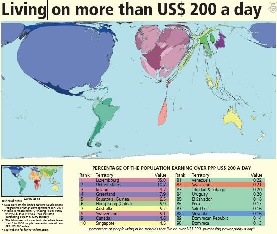
Market Research conducted by Paul Budde Communications indicates that 1 year of Internet access is greater than the annual income of most Africans. Only in Egypt, Libya, and Mauritius is the annual cost of Internet access < 10% of the annual income. A study on Promoting African Research & Education Networking (PAREN), sponsored by IDRC, in Jan 2005 showed that African universities pay on average 50 times more for bandwidth than, for example, U.S. universities ($5.46/ Kbps/month vs. $0.12/Kbps/month). W. Africa pays on average $8/Kbps/month, and N Africa $0.52/Kbps/month. An OECD study on Broadband in November 2007 showed a median for OECD countries of $16/Mbps/month with Japan at $3.09/Mbps/month. Even a recent Bandwidth Initiative by a c alition of 11 African Universities (MZ, TZ, UG, GH, NG, KY) + four major US Foundations to provide satellite thru Intelsat though it reduced the costs by a factor of three they are still at $2.23K/Mbps/month. Thus Africans are paying hundreds of times what is being paid by residences in OECD countries.
...
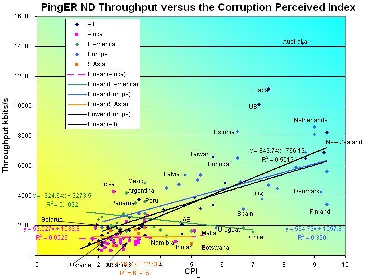
The Corruption Perception Index (CPI) from Transparency International relates to perceptions of the degree of corruption as seen by business people and country analysts, and ranges between 10 (highly clean) and 0 (highly corrupt). It covers 180 countries. See figure 8 for a map of its values for various countries in 2006. The correlation between the Normalized derived throughput and the CPI is shown below. The overall correlation of R^2~0.55 is good, however if one looks at the correlations for a region such as Latin America, South Asia or Africa it is very poor and negative in the case of Latin America.
Routing and Bandwith use
According to Mike Jensen, in 2002 there is was almost no intra-African Internet connectivity and the vast majority of international bandwidth lands in the G8 countries - principally North America followed by Europe (Belgium, France, Germany, Italy, Netherlands, Norway, Portugal, and the UK). High intra-regional telecom prices have limited the establishment of links between neighbouring countries to just 5 - Gambia-Senegal, and South Africa's links to Namibia, Lesotho, Swaziland and Botswana. As a result increasing amounts of intra-African traffic must be transited through high cost cross-continental links. ?The utilization of bandwidth in 2002 is seen in the figure below. 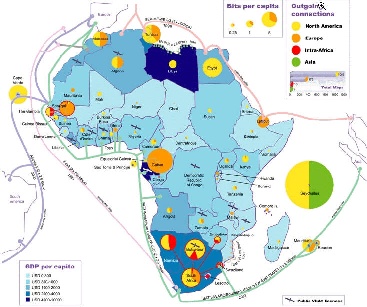
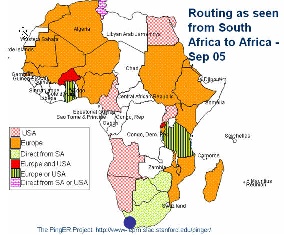
Looking at the figure below of the routing from the best connected country in Sub Saharan Africa, i.e. South Africa to the rest of Africa in 2005 it is seen that aprt from to Zimbabwe and Botswana traffic was routed via other continents. Not only does this increase costs but it means that In essence the African community is subsidizing the international carriers.
What is needed is to put into place International eXchange Points (IXPs) between countries to reduce costs and improve performance. This requires users (universities, countries) to band together to leverage influence, get deals etc. There is evidence of this happening in Ubuntunetand the Bandwidth Initiative referred to above. However, current providers (cable and satellite) have a lot to loose and many of these have close links to regulators and governments (e.g. over 50% of ISPs in Africa are government controlled), so this will be difficult in many cases and may require government intervention. Also the regulatory regimes on the whole are closed and resistant to change, and
sometimes ISPs themselves are unwilling to co-operate
...
In 2006, the ATICS survey of 84 leading tertiary institutions in Africa found 850,000 students and staff with access to a total of only 100Mbps international bandwidth. By contrast, Australia?'s tertiary community of 250,000 share 6Gbps of international bandwidth (although even this is still insufficient to meet their needs).
...
An interesting way to analyze the state of internet connectivity in Africa is to look at colored maps of various metrics as seen from our monitoring node in South Africa. 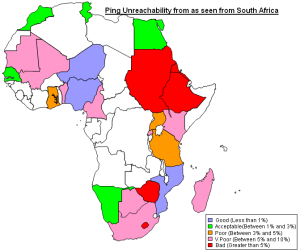
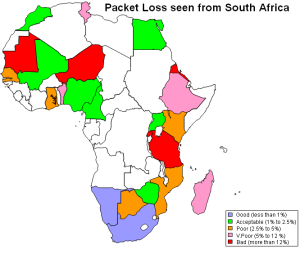
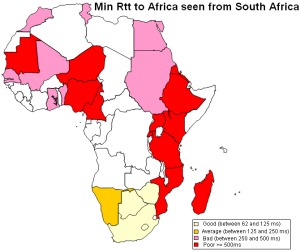
Ping Unreachability Packet Loss Min_rtt
Routing in Africa seen from SLAC
Using programs written to analyze traceroutes for different regions we have been able to generate topology maps of various regions in Africa as seen from SLAC. These maps provide a valuable insight into the various ASNs that are encountered as packets are routed from SLAC to Africa.
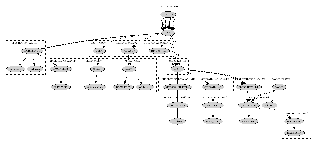

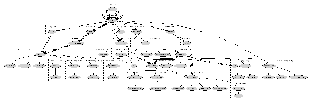
SLAC to West Africa SLAC to South Africa SLAC to East Africa
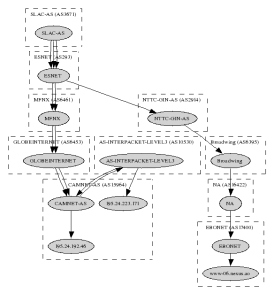
SLAC to Central Africa
Initiatives
The SAT3 fibre serves some countries of Western and Southern Africa. The EASSY fibre is intended to assist Eastern Africa.
Useful Links
ICT in Africa: a Status Report, Mike Jensen
West Africa Submarine cable Connection
Web Atlas of Regional Integration in West Africa
African Scientific Network
African Universities
Columbia University Africa Studies
Lowering the Cost of Internet Access in Africa
The bandwidth Initiative: Opening the power of the Internet to African Universities
University of Zambia Status.
Submarine Cables