...
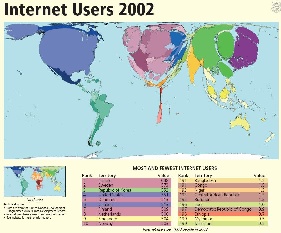
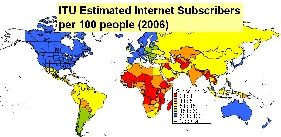
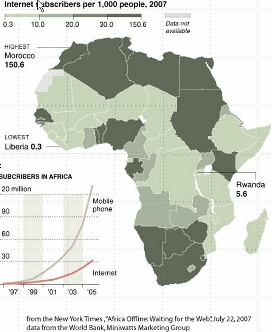
Another way of looking at the poor situation in Africa is to look at Figure 10, illustrating the lack of Internet users in Africa compared to the rest of the world. At the bottom left of figure 10c is shown the growth of Internet users and cell phone subscribers. This may suggest that cell phone infrastructure may be a very valuable way to leverage Internet growth.
Figure 10a: | Figure 10b: | Figure 10c: |
|---|---|---|
| | |
...
There is only one large-scale intercontinental fibre link to Sub-Saharan Africa (SAT-3/WASC/SAFE) which provides connections to Europe (via Portugal) and the Far East for eight countries (Senegal, Ivory Coast, Ghana, Benin, Nigeria, Cameroon, Gabon and Angola) along the West Coast of the Continent . Except for some onward links from South Africa to its neighbours, and from Sudan to Egypt and from Senegal to Mali, the remaining 33 African countries are unconnected to the global optical backbones, and depend on the much more limited and high-cost bandwidth from satellite links. Even the few countries that have access to international fibre through SAT-3 are not seeing the benefits because it is operated as a consortium where connections are charged at monopoly prices by the state owned operators which still predominate in most of Africa, and in many other developing regions.The first large-scale international fibre project in sub-Saharan Africa, SAT-3/WASC's first segment connects Portugal to the Cape in South Africa reaching eight coastal countries along the way: Senegal, Ivory Coast, Ghana, Benin, Nigeria, Cameroon, Gabon and Angolaand south to the Cape in South Africa. A second segment, in the Indian Ocean, connects South Africa to Malaysia while passing through Mauritius and India (SAFE). Jointly funded by 36 members and spearheaded by South African Telkom which invested US$85 million for a 13 per cent stake, the project cost about US$650 million dollars. The cable was expected to lead to much reduced international bandwidth costs, but so far this has not occurred due to the business models used to develop the project.to the business models used to develop the project. Even the few countries that have access to international fibre through SAT-3 are not seeing the benefits because it is operated as a consortium where connections are charged at monopoly prices by the state owned operators which still predominate in most of Africa, and in many other developing regions. Landlocked African operators who have tried to purchase international fibre capacity directly from one of the consortium's international members have found themselves being charged as much to reach the SAT-3 landing point as they were charged to get from the landing station to Portugal. Sadly Sadly, the high costs have made it cheaper to send the traffic directly by satellite, even for SAT-3 shareholders such as Telecom Namibia, which has no landing point of its ownhas no landing point of its own. Except for some onward links from South Africa to its neighbours, and from Sudan to Egypt and from Senegal to Mali, the remaining 33 African countries are unconnected to the global optical backbones, and depend on the much more limited and high-cost bandwidth from satellite links.
Mike Jensen
In fact prices have barely come down since it began operating in 2002 and are sold at satellite prices of $4-8K/Mbps/mo even though the capacity is only 5% used. As a result the lack of fibre and lack of competition on SAT-2, international bandwidth to African countries, as seen in Figure 12 lags well behind most of the rest of the world.
...
Market Research conducted by Paul Budde Communications indicates that 1 year of Internet access is greater than the annual income of most Africans. Only in Egypt, Libya, and Mauritius is the annual cost of Internet access < 10% of the annual income. A study on Promoting African Research & Education Networking (PAREN), sponsored by IDRC, in Jan 2005 showed that African universities pay on average 50 times more for bandwidth than, for example, U.S. universities ($5.46/ Kbps/month vs. $0.12/Kbps/month). W. Africa pays on average $8/Kbps/month, and N Africa $0.52/Kbps/month. An OECD study on Broadband in November 2007 showed a median for OECD countries of $16/Mbps/month with Japan at $3.09/Mbps/month. Even a recent Bandwidth Initiative by a c alition of 11 African Universities (MZ, TZ, UG, GH, NG, KY) + four major US Foundations to provide satellite thru Intelsat though it reduced the costs by a factor of three they are still at $2.23K/Mbps/month. Thus Africans are paying hundreds of times what is being paid by residences in OECD countries.
Opportunities
In 2006 Africa has had close to 1 billion people or about 14% of the world's population. Its usage is also growing faster than the rest of the world. However, the Internet penetration shown in the table below is only about 3.6% so it is a huge potential market.
...
Also the UN, governments such as China, the UK, Europe, the US and companies such as AMD, Intel,Microsoft, Cisco, Nokia and Ericsson are recognizing the opportunities and needs and investing. This will introduce challenges of new development models such as more inclusive business models; bottoms-up approach; working in new regulatory, policy and poor infrastructural availability environments; working with governments and others to ensure fibres are installed with any major relevant projects (railways, roads, electricity pylons etc.); micro-payments; content in many new local languages; use of wireless for last mile connections, ; Internet kiosks and cafes, etc.
...
- Recognize cannot fix all ills for all people over night.
- Identify where to focus on and invest effort. One good area is educating the teachers & students so they can teach others etc, so Education & Research is often a leader.
- Choose a champion application (e.g. education, science, telemedicine, video conferencing, distance learning)
- Find energetic leaders from a country/region to lead the mission forward. Illustrate the way and the gains.
- Engage policy makers for science, IT, research, technology to raise awareness, help them understand the needs, identify the gains for the country (increased productivity in Information Age), and for them to provide encouragement for IT and networking, e.g. by addressing funding, taxation, regulation, competition, education/skills, improved infrastructure (e.g. power), digital literacy, Internet adoption, create incentives, reward effort?, etc.
- Collaborate between institutions in a region (e.g. create consortium), between leading disciplines, between countries (e.g. for Internet Exchange Points) etc. to increase influence, show leadership, negotiating, collective bargaining etc.
- Partner with vendors (e.g. of equipment, fibre, Internet) to lead the way, showcase leadership, start market penetration, create demand. It's a long term investment in the future both for the company and the country.
- Get support from collaborators in other countries, from organizations (e.g. IHY, ICTP, ICFA, HEP, Physical Societies...) and possible sources of funding (NSF, GEANT, EU, World Bank, Microsoft foundation ?).
- Utilize measurements to quantify, explain and support case (e.g. ITU, UNDP, PingER, World Bank, CIA ...) and to see the effects of improvements.
- Recognize the needs for new business/development models models appropriate for AfricaAfrican countries.
Conclusions
- Poor performance affects data transfer, multi-media, VoIP, IT development & country performance / development
- DD exists between regions, within regions, within countries, rural vs cities, between age groups?
- Decreasing use of satellites, expensive, but still needed for many remote countries in Africa and C. Asia
- Last mile problems, and network fragility
- International Exchange Points (IXPs) needed
- Internet performance (non subjective, relatively easy/quick to measure) correlate strongly with economic/technical/development indices
- Increase coverage of monitoring to understand Internet performance and validate improvements
- Africa worst by all measures (throughput, loss, jitter, DOI, international bandwidth, users, costs ?) and falling further behind.
...
- Sudan shifted from average rtt RTT of approx. 685 ms to approx. 260 ms in Nov 2004. This is a classic case of shift from Satellite to Fiber. However there is are no remarkable trends visible in the throughput. This is explained by the increase in packet loss over the same period of time. Thus the improvement in rtt was compensated by the increase in packet loss and the overall throughput fails to show any meaningful increasing trend.
...