...
| Include Page | ||||
|---|---|---|---|---|
|
...
PingER Metrics
...
For African countries the PingER metrics are sgwon for Jan-Sep 2007 in the figure below:
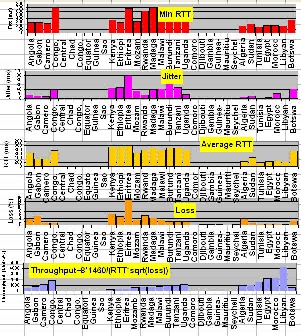
One Another way of showing how Africa is behind the rest of the world from the point of view of PingER Internet measures is to show maps of the performance of each metric for several metrics for January through September 2007. These are shown in the Figures below.
Red indicates geostationary satellite | Voice & Video de-jitter required | Host & Network Fragility | Data Transfer |
|---|---|---|---|
| | | |
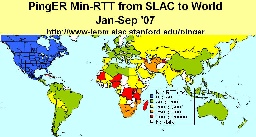
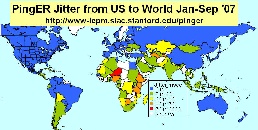
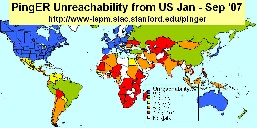
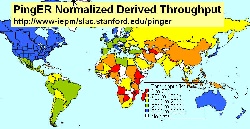
. These are shown in the Figures below.
Red indicates geostationary satellite | Voice & Video de-jitter required | Host & Network Fragility | Data Transfer |
|---|---|---|---|
| | | |
Correlation between PingER and Other Metrics
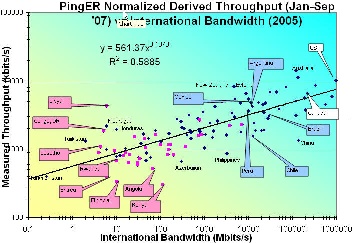
The figure below shows the correlation between International bandwidth Inn Figure 12) and the normalized derived PingER throughput. It can be seen that the correlation is good (R^2 ~ 0.59). It is also seen that the African countries (in Magenta) lie towards the bottom left where both the throughput and International Bandwidth are low. Libya is an anomaly since the only site monitored there is the email server for the Libya Telecommunications which should have good connectivity compared to most sites in Libya.
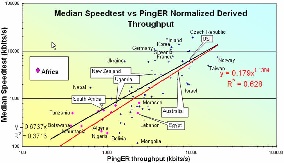
To verify whether the order of magnitude of the normalized derived throughput is correct we compare it with the Speedtest results from www.zdnet.com.au/broadband/results.htm. This application sends a known amount of data between your computer and servers in Australia. Then it measures throughput and besides returning the result to the user, it also saves and makes available the results by country and ISP. The correlation is shown in the figure below. The orders of magnitude of the two methods agree and there is a strong correlation. As expected the African countries have the poorest results.
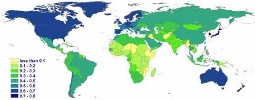
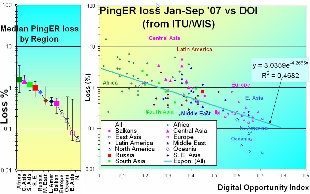
The International Telecommunications Union's Digital Opportunity Index (DOI) measures countries' ICT capabilities in infrastructure, access path and device, affordability and coverage, and quality. It covers 180 countries, and has recent (data 2005, announced in 2006). There are 11 indicators: that cover mobile telephony coverage, Internet tariffs, #computers, fixed line phones, mobile subscribers, Internet users all in relation to the population of the country. A map of the values for world countries and the correlation with the normalized derived PingER throughput is shown in the figures below. The Correlation is fairly good. As usual Africa is the worst off being 30 time worse than the US in terms of loss.
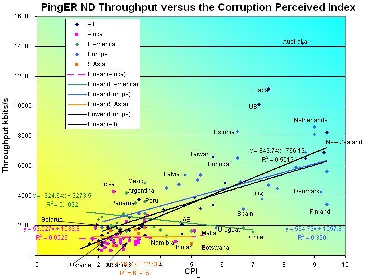
The correlation between the Normalized derived throughput and the Corruption Perceived Index (CPI) is shown below. the overall correlation of R^2~0.55 is good, however if one looks at the correlations for a region such as Latin America, South Asia or Africa it is very poor and negative in the case of Latin America.
"The Human Development Index (HDI) is the measure of life expectancy, literacy, education, and standard of living for countries worldwide. It is a standard means of measuring well-being, especially child welfare. It is used to determine and indicate whether a country is a developed, developing, or underdeveloped country and also to measure the impact of economic policies on quality of life." from Wikipedia.
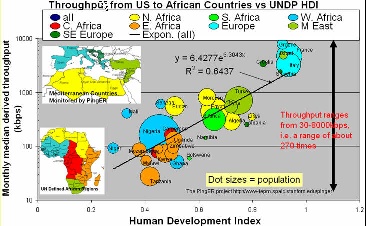
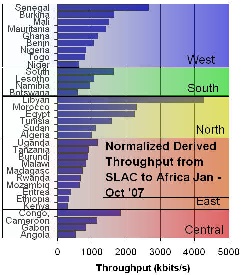
The figure below shows the correlation between the HDI and the normalized derived PingER throughput for Mediterranean and African countries. The correlation is seen to be strong (R^2~0.64). It is also seen that N. Africa has 10 times poorer performance than Europe, yet N. Africa is several times better than say E. Africa. E. Africa is poor, limited by its satellite access. For W. Africa there are big differences, some such as Senegal can afford SAT3 fibre while others use satellite, There is great diversity between and within regions. This is also show for the normalized derived PingER throughput for Africa in the figure to the right where one can see the overall throughput performance is poor to bad. There is a factor of 10 difference between Angola and Libya. N Africa is the best, and E Africa the worst. There are big differences within regions. In 2002, BW/capita ranged from 0.02 to over 40bps - a factor of over 1000
Routing
According to Mike Jensen, in 2002 ?there is almost no intra-African Internet connectivity and the vast majority of international bandwidth lands in the G8 countries - principally North America followed by Europe (Belgium, France, Germany, Italy, Netherlands, Norway, Portugal, and the UK). High intra-regional telecom prices have limited the establishment of links between neighbouring countries to just 5 - Gambia-Senegal, and South Africa's links to Namibia, Lesotho, Swaziland and Botswana. As a result increasing amounts of intra-African traffic must be transited through high cost cross-continental links.?
...
- Recognize cannot fix all ills for all people over night.
- Identify where to focus on and invest effort. One good area is educating the teachers & students so they can teach others etc, so Education & Research is often a leader.
- Choose a champion application (e.g. education, science, telemedicine, video conferencing, distance learning)
- Find energetic leaders from a country/region to lead the mission forward. Illustrate the way and the gains.
- Engage policy makers for science, IT, research, technology to raise awareness, help them understand the needs, identify the gains for the country (increased productivity in Information Age), and for them to provide encouragement for IT and networking, e.g. by addressing funding, taxation, regulation, competition, education/skills, improved infrastructure (e.g. power), digital literacy, Internet adoption, create incentives, reward effort?
- Collaborate between institutions in a region (e.g. create consortium), between leading disciplines, between countries (e.g. for Internet Exchange Points) etc. to increase influence, show leadership, negotiating, collective bargaining etc.
- Partner with vendors (e.g. of equipment, fibre, Internet) to lead the way, showcase leadership, start market penetration, create demand. It's a long term investment in the future both for the company and the country.
- Get support from collaborators in other countries, from organizations (e.g. IHY, ICTP, ICFA, HEP, Physical Societies...) and possible sources of funding (NSF, GEANT, EU, World Bank, Microsoft foundation ?).
- Utilize measurements to quantify, explain and support case (e.g. ITU, UNDP, PingER, World Bank, CIA ...) and to see the effects of improvements.Leverage the envy factor.
- Recognize the needs for new business/development models such as
Conclusions
- Poor performance affects data transfer, multi-media, VoIP, IT development & country performance / development
- DD exists between regions, within regions, within countries, rural vs cities, between age groups?
- Decreasing use of satellites, expensive, but still needed for many remote countries in Africa and C. Asia
- Last mile problems, and network fragility
- International Exchange Points (IXPs) needed
- Internet performance (non subjective, relatively easy/quick to measure) correlate strongly with economic/technical/development indices
- Increase coverage of monitoring to understand Internet performance and validate improvements
- Africa worst by all measures (throughput, loss, jitter, DOI, international bandwidth, users, costs ?) and falling further behind.
...