Introduction
The following Case Study of Sub-Saharan Africa was put together following the "2nd IHY-Africa Workshop" 11-16 November 2007, Addis Ababa, Ethiopia,
and the "Internet & Grids in Africa: An Asset for African Scientists for the Benefit of African Society", 10-12 December 2007, Montpellier, France. It contains most of the information presented plus much more background information.
African Situation
Internet coverage and performance in the Sub Sahara region of Africa (see Figure 1, for the UN definition of the Sub-Sahara) is exceedingly poor. This is illustrated by the number of Internet connections per city worldwide seen in Figure 2 where it is seen that Africa stands out as almost lacking any (i.e. it is dark). Figure 3 illustrates how Africa has very little submarine cable connectivity (white lines) compared to the rest of the world.
...
International capacity to African countries is mainly provided via satellite or via fibre links. Typically bandwidth costs in $/Mbits/s are 300-1000 times as expensive as fibreSatellite links are not only much more expensive (300-1000 times) in terms of $/Mbps but they also induce long delays of over 400mseconds that result in lack of interactivity and poor performance. However in 2004 only 14 of 49 sub-Saharan countries had access to fibre according to NEPAD. In fact as seen in Figure 11:
...
In fact prices have barely come down since it began operating in 2002 and are sold at satellite prices of $4-8K/Mbps/mo even though the capacity is only 5% used. As a result the lack of fibre and lack of competition on SAT-2, international bandwidth to African countries, as seen in Figure 12 lags well behind most of the rest of the world.
It should also be pointed out that the fact there is only one fibre optic cable means the only backup is satellite which may not be configured to take the re-0reouted traffic, and in any case may have inadequate capacity.
Costs
| Wiki Markup |
|---|
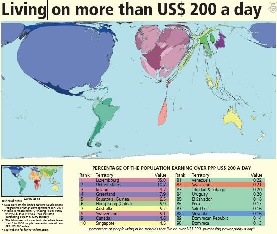
One result and immediate cause of this is the cost of this are costs of Internet connections in Africa and how they relate to income (Compare Figure 13a and 13b) and affordability. For example "Currently \[2007\] prices on SAT-3 are up to US$15 000 / Mbps/month, while it is estimated to cost the consortium only about US$300/Mbps/month". From a posting by Dewayne Hendricks on Dave Farber's Iper list \-\- Bill St Arnaud. |
Figure 13a: 2002 | Figure 13b: |
|---|---|
|
|
Market Research conducted by Paul Budde Communications indicates that 1 year of Internet access is greater than the annual income of most Africans. Only in Egypt, Libya, and Mauritius is the annual cost of Internet access < 10% of the annual income. A study on Promoting African Research & Education Networking (PAREN), sponsored by IDRC, in Jan 2005 showed that African universities pay on average 50 times more for bandwidth than, for example, U.S. universities ($5.46/ Kbps/month vs. $0.12/Kbps/month). W. Africa pays on average $8/Kbps/month, and N Africa $0.52/Kbps/month. An OECD study on Broadband in November 2007 showed a median for OECD countries of $16/Mbps/month with Japan at $3.09/Mbps/month. Even a recent Bandwidth Initiative by a c alition of 11 African Universities (MZ, TZ, UG, GH, NG, KY) + four major US Foundations to provide satellite thru Intelsat though it reduced the costs by a factor of three they are still at $2.23K/Mbps/month. Thus Africans are paying hundreds of times what is being paid by residences in OECD countries.
Opportunities
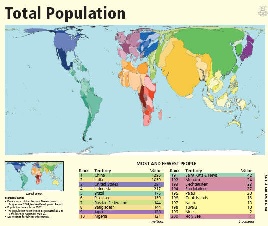
Africa has close to 1 billion people or about 14% of the world's population. However, the Internet penetration shown in the table below is only about 3.6% so it is a huge potential market.
...
| Include Page | ||||
|---|---|---|---|---|
|
Maps of Various PingER Metrics
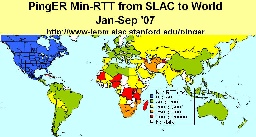
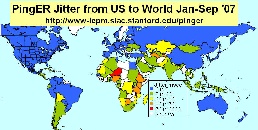
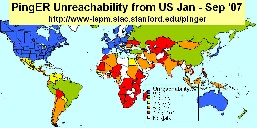
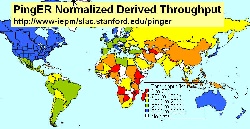
Another way of showing how Africa is behind the rest of the world from the point of view of PingER Internet measures is to show maps of the performance of each metric for January through September 2007. These are shown in the Figures below.
Red indicates geostationary satellite | Voice & Video de-jitter required | Host & Network Fragility | Data Transfer |
|---|---|---|---|
| |
| |
Routing
According to Mike Jensen, in 2002 ?there is almost no intra-African Internet connectivity and the vast majority of international bandwidth lands in the G8 countries - principally North America followed by Europe (Belgium, France, Germany, Italy, Netherlands, Norway, Portugal, and the UK). High intra-regional telecom prices have limited the establishment of links between neighbouring countries to just 5 - Gambia-Senegal, and South Africa's links to Namibia, Lesotho, Swaziland and Botswana. As a result increasing amounts of intra-African traffic must be transited through high cost cross-continental links.?
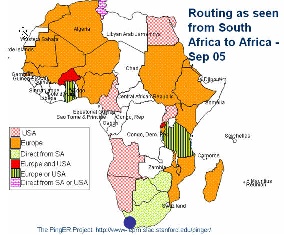
Looking at the figure below of the routing from the best connected country in Sub Saharan Africa, i.e. South Africa to the rest of Africa in 2005 it is seen that aprt from to Zimbabwe and Botswana traffic was routed via other continents. Not only does this increase costs but it means that In essence the African community is subsidizing the international carriers.
What is needed is to put into place International eXchange Points (IXPs) between countries to reduce costs and improve performance. This requires users (universities, countries) to band together to leverage influence, get deals etc. There is evidence of this happening in Ubuntunetand the Bandwidth Initiative referred to above. However, current providers (cable and satellite) have a lot to loose and many of these have close links to regulators and governments (e.g. over 50% of ISPs in Africa are government controlled), so this will be difficult in many cases and may require government intervention. Also the regulatory regimes on the whole are closed and resistant to change, and
sometimes ISPs themselves are unwilling to co-operate
Some Examples of the Impact
A survey by Les Cottrell and Monique Petitdidier at the IHY meeting Ethiopia in November 2007 of leading Universities in 17 countries showed the following:
- Each had tens of 1000's of students, 1000 or so staff
- Best had 2 Mbits, worst dial up 56kbps
- Often access restricted to faculty
Other examples from Heloise Emdon at the Acacia Southern Africa UNDP Global Meeting for ICT for Development, in Ottawa 10-13 July 2006 include:
- School in a secondary town in an East Coast country with networked computer lab spends 2/3rds of its annual budget to pay for the dial-up connection. It gives up and disconnects.
- A primary health care giver, somewhere in Africa, with sonar machine, digital camera and arrangement with national academic hospital and/or international health institute to assist in diagnostics. After 10 dial-up attempts, she abandons attempts to connect.
- Telecentre in a country with fairly good connectivity has no connectivity. The telecentre resorts to generating revenue from photocopies, PC training, CD Roms for content.
Also from the Harvard African Higher Education Study:
- Access to the internet is so desirable to students in Africa that they spend considerable time and money to get it. Many students surveyed, with no internet connection at their universities, resorted to private, fee-charging internet cafes to study and learn.
Possible Remedies
Advantage of investing in IT
In the industrial age a pre-requisite was an expensive infrastructure of roads, railways, ports to distribute raw materials and products, plus factories (e.g. steel making, cars etc.). In today?s information age: help, technical information is readily accessible online, so one person with a computer and an Internet connection can be productive (e.g. outsourcing of help, information services etc.) An Internet connection is a necessary pre-requisite and cheaper to install than a highway. To compete in today?s world, investment in IT and networking is critical to enable opportunity and productivity. It can also help minimize brain drain by making Africa more attractive to trained people.
Digital Divide Steps
It is clear that there are many Digital Divides, by region, country, within countries, age groups, city vs rural etc. How one tackles the DD varies from country to country, region to region etc. Typically we (International Committee on Future Accelerators (ICFA) / Standing Committee on Inter-regional Connectivity (SCIC)) have seen for Brazil, Romania, Pakistan and India it involves :
- Recognize cannot fix all ills for all people over night.
- Identify where to focus on and invest effort. One good area is educating the teachers & students so they can teach others etc, so Education & Research is often a leader.
- Choose a champion application (e.g. education, science, telemedicine, video conferencing, distance learning)
- Find energetic leaders from a country/region to lead the mission forward. Illustrate the way and the gains.
- Engage policy makers for science, IT, research, technology to raise awareness, help them understand the needs, identify the gains for the country (increased productivity in Information Age), and for them to provide encouragement for IT and networking, e.g. by addressing funding, taxation, regulation, competition, education/skills, improved infrastructure (e.g. power), digital literacy, Internet adoption, create incentives, reward effort?
- Collaborate between institutions in a region (e.g. create consortium), between leading disciplines, between countries (e.g. for Internet Exchange Points) etc. to increase influence, show leadership, negotiating, collective bargaining etc.
- Partner with vendors (e.g. of equipment, fibre, Internet) to lead the way, showcase leadership, start market penetration, create demand. It's a long term investment in the future both for the company and the country.
- Get support from collaborators in other countries, from organizations (e.g. IHY, ICTP, ICFA, HEP, Physical Societies...) and possible sources of funding (NSF, GEANT, EU, World Bank, Microsoft foundation ?).
- Utilize measurements to quantify, explain and support case (e.g. ITU, UNDP, PingER, World Bank, CIA ...) and to see the effects of improvements.
- Leverage the envy factor.
Conclusions
- Poor performance affects data transfer, multi-media, VoIP, IT development & country performance / development
- DD exists between regions, within regions, within countries, rural vs cities, between age groups?
- Decreasing use of satellites, expensive, but still needed for many remote countries in Africa and C. Asia
- Last mile problems, and network fragility
- International Exchange Points (IXPs) needed
- Internet performance (non subjective, relatively easy/quick to measure) correlate strongly with economic/technical/development indices
- Increase coverage of monitoring to understand Internet performance and validate improvements
- Africa worst by all measures (throughput, loss, jitter, DOI, international bandwidth, users, costs ?) and falling further behind.
Appendix Interesting Trends:
- Sudan shifted from average rtt of approx. 685 ms to approx. 260 ms in Nov 2004. This is a classic case of shift from Satellite to Fiber. However there is are no remarkable trends visible in the throughput. This is explained by the increase in packet loss over the same period of time. Thus the improvement in rtt was compensated by the increase in packet loss and the overall throughput fails to show any meaningful increasing trend.
...
