...
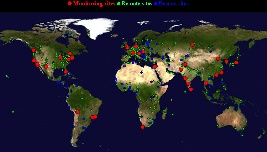
Figure 15: PingER Deployment Dec 2007, red are monitoring sites, blue beacons that are monitored from most monitoring sites and green the monitored only sites. |
|
|---|---|
| |
|
Worldwide Comparison
| Include Page | ||||
|---|---|---|---|---|
|
MOS for various Regions
| Include Page | ||||
|---|---|---|---|---|
|
Information on Calculation MOS can be found at http://www.slac.stanford.edu/comp/net/wan-mon/tutorial.html#mos
Interesting Trends:
- Sudan shifted from average rtt of approx. 685 ms to approx. 260 ms in Nov 2004. This is a classic case of shift from Satellite to Fiber. However there is are no remarkable trends visible in the throughput. This is explained by the increase in packet loss over the same period of time. Thus the improvement in rtt was compensated by the increase in packet loss and the overall throughput fails to show any meaningful increasing trend.
...