Introduction
African Situation
Internet coverage and performance in the Sub Sahara region of Africa (see Figure 1, for the UN definition of the Sub-Sahara) is exceedingly poor. This is illustrated by the number of Internet connections per city worldwide seen in Figure 2 where it is seen that Africa stands out as almost lacking any (i.e. it is dark). Figure 3 illustrates how Africa has very little submarine cable connectivity (white lines) compared to the rest of the world.
...
Also the UN, governments such as China, the UK, Europe, the US and companies such as AMD, Intel,Microsoft, Cisco, Nokia and Ericsson are recognizing the opportunities and needs and investing. This will introduce challenges of new development models such as more inclusive business models; bottoms-up approach; working in new regulatory, policy and poor infrastructural availability environments; micro-payments; content in many new local languages; use of wireless for last mile connections, Internet kiosks and cafes, etc.
PingER and Internet Performance in Africa
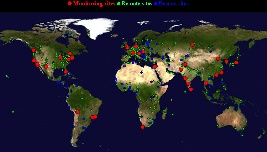
The PingER project is arguably the most extensive active end-to-end Internet performance measurement project today. It data goes back over a decade and more recently has focused on measuring the Digital Divide. It covers measurements from over 16 countries to over 150 countries (see Figure 15) containing over 99% of the world's Internet connected population. 45 of the countries are in Africa.
Figure 15: PingER Deployment Dec 2007, red are monitoring sites, blue beacons that are monitored from most monitoring sites and green the monitored only sites. |
|
|---|---|
| |
|
...
Worldwide Comparison
| Include Page | ||||
|---|---|---|---|---|
|
Interesting Trends:
- Sudan shifted from average rtt of approx. 685 ms to approx. 260 ms in Nov 2004. This is a classic case of shift from Satellite to Fiber. However there is are no remarkable trends visible in the throughput. This is explained by the increase in packet loss over the same period of time. Thus the improvement in rtt was compensated by the increase in packet loss and the overall throughput fails to show any meaningful increasing trend.
...
