...
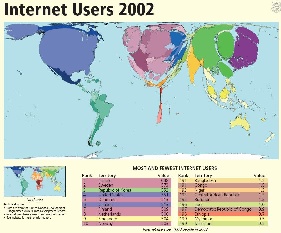
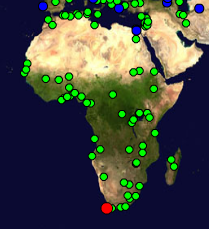
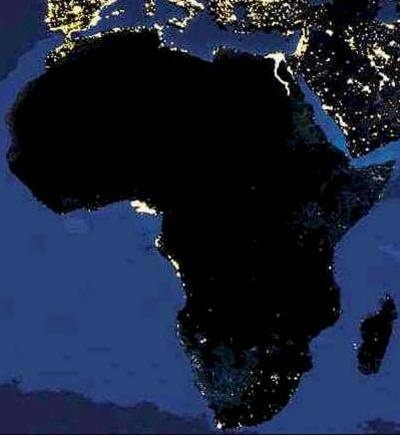
Another way of looking at the poor situation in Africa is to look at Figure 410, a cartogram illustrating the lack of Internet users in Africa compared to the rest of the world.
Figure 10a: | Figure 10b 4: |
|---|---|
| |
...
Costs
One result and immediate cause of this is the cost of this are costs of Internet connections in Africa.
Capacity
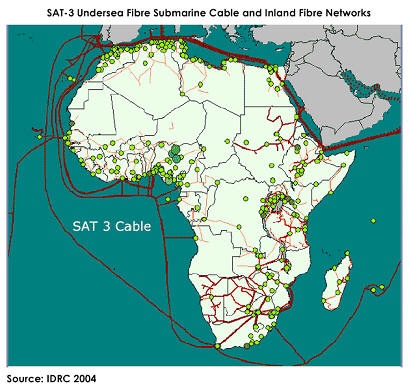
International capacity to African countries is mainly provided via satellite or via fibre links. Typically bandwidth costs in $/Mbits/s are 300-1000 times as expensive as fibre. However in 2004 only 14 of 49 sub-Saharan countries had access to fibre according to NEPAD. In fact as seen in Figure 11:
Figure 11: Fibre links to and within Africa and the locations of universities | Figure 12: |
|---|---|
| |
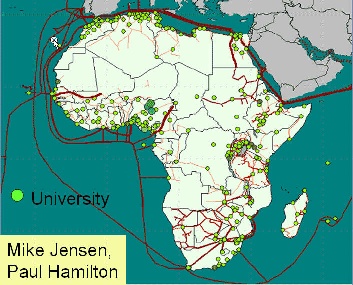
There is only one large-scale intercontinental fibre link to Sub-Saharan Africa (SAT-3/WASC/SAFE) which provides connections to Europe and the Far East for eight countries along the West Coast of the Continent. Except for some onward links from South Africa to its neighbours, and from Sudan to Egypt and from Senegal to Mali, the remaining 33 African countries are unconnected to the global optical backbones, and depend on the much more limited and high-cost bandwidth from satellite links. Even the few countries that have access to international fibre through SAT-3 are not seeing the benefits because it is operated as a consortium where connections are charged at monopoly prices by the stateowned operators which still predominate in most of Africa, and in many other developing regions. In fact prices have barely come down since it began operating in 2002.
The first large-scale international fibre project in sub-Saharan Africa, SAT-3/WASC's first segment connects Portugal to the Cape in South Africa reaching eight coastal countries along the way: Senegal, Ivory Coast, Ghana, Benin, Nigeria, Cameroon, Gabon and Angola. A second segment, in the Indian Ocean, connects South Africa to Malaysia while passing through Mauritius and India (SAFE). Jointly funded by 36 members and spearheaded by South African Telkom which invested US$85 million for a 13 per cent stake, the project cost about US$650 million dollars. The cable was expected to lead to much reduced international bandwidth costs, but so far this has not occurred due to the business models used to develop the project.
Landlocked African operators who have tried to purchase international fibre capacity directly from one of the consortium's international members have found themselves being charged as much to reach the SAT-3 landing point as they were charged to get from the landing station to Portugal. Sadly, the high costs have made it cheaper to send the traffic directly by satellite, even for SAT-3 shareholders such as Telecom Namibia, which has no landing point of its own.
Mike Jensen
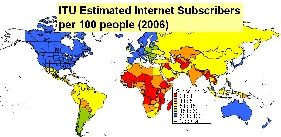
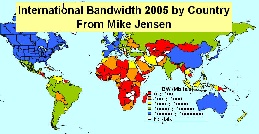
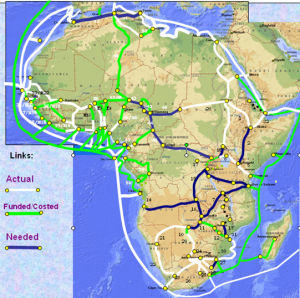
As a result the international bandwidth to African countries, as seen inf Figure 12 lags well behind most of the rest of the world.
Opportunities
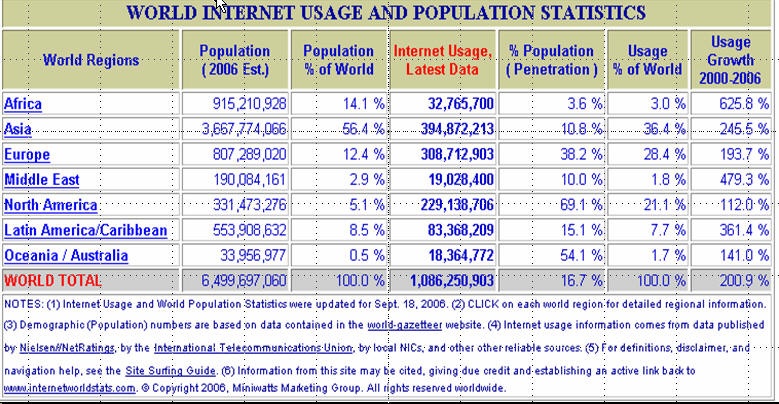
Africa has close to 1 billion people or about 14% of the world's population. However, the Internet penetration shown in the table below is only about 3.6% so it is a huge potential market. However, this will introduce challenges of new business models (e.g. micro-payments, content ion many new local languages etc.).

Interesting Trends:
...
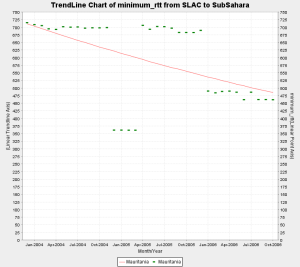
- Mauritania shows interesting behaviour. One of the hosts we monitor (www.pmd.mr) shows improved connectivity around Jan 2006 indicating a shift from satellite to landline. However the other host (www.maurifemme.mr), which is indicated as being on satellite and located in Norway (courtesy http://www.geoiptool.com) is showing the same rtt of around 680+ ms. If this host is actually in Mauritania then we can conclude that some parts of the country have shifted to fibre but others are still on satellite.
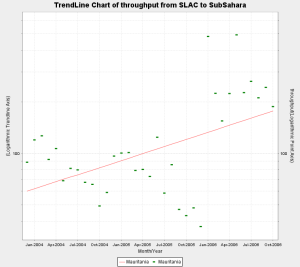
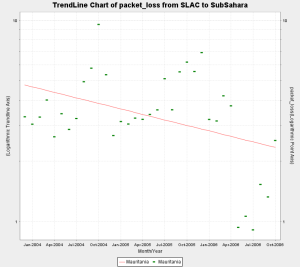
- In addition the throughput and packet loss for the both hosts show marked improvement since Jan 2006 which indicates better connectivity.
- Uganda has shown steady improvement in throughput and loss quality over the years since we started monitoring it in 2000. However the min_rtt of above 600 ms and the avg_rtt around 800 ms indicates that it is still mostly on Satellite.
...