...
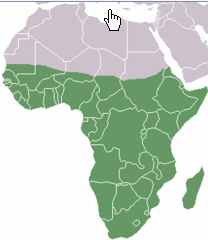
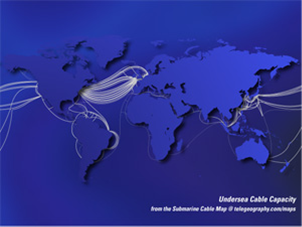
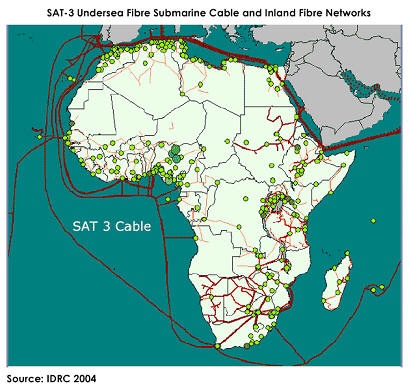
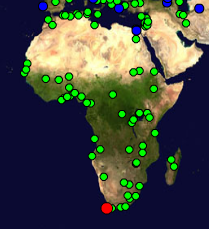
Internet coverage and performance in the Sub Sahara region of Africa (see Figure below at the left1, for the UN definition of the Sub-Sahara) is exceedingly poor. This is illustrated by the number of Internet connections per city worldwide seen in the next Figure , 2 where it is seen thatt that Africa stands out as almost lacking of any (i.e. it is dark). Figure 3 illustrates how Africa has very little submarine cable connectivity (white lines) compared to the rest of the world.
Figure 1: UN Definition of Sub-Sahara | Figure 2: World Internet Connection Density | Figure 3: Submarine Cables 2007, from telegeography.com Light at night from Space | |
|
| | |
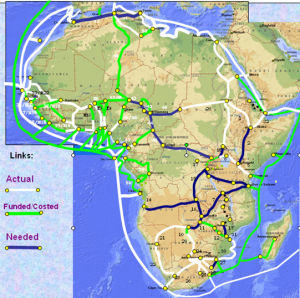
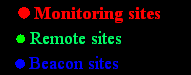
African cables 2004 | Africa cable plans 2006 | Pinger Deployment of Monitoring sites (red) & monitored sites (green) s |
| | | |
|
|

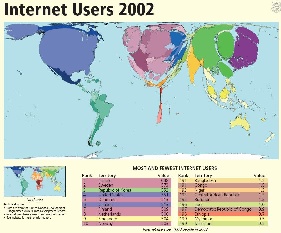
Another way of looking at the poor situation in Africa is to look at Figure 4 showing a catrogram from http://www.worldmapper.org/![]() illustrating the lack of Internet users in Africa compared to the rest of the world.
illustrating the lack of Internet users in Africa compared to the rest of the world.
Figure 4: Cartogram (equal area for equal Internet users) for 2002 from Worldmapper.com |
|---|
|
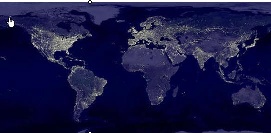
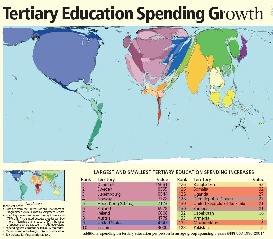
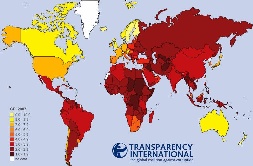
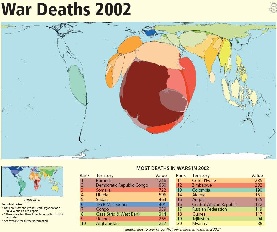
There are many reasons for this poor connectivity including: electricity (see Figure 5 for the light at night for the world and compare Africa with the rest of the world), import duties, skills (see Figure 6), disease, protectionist policies, corruption (see Figure 7), conflict (see Figure 8).
|
|
|
|
|---|---|---|---|
| | ||
| |
Interesting Trends:
- Sudan shifted from average rtt of approx. 685 ms to approx. 260 ms in Nov 2004. This is a classic case of shift from Satellite to Fiber. However there is are no remarkable trends visible in the throughput. This is explained by the increase in packet loss over the same period of time. Thus the improvement in rtt was compensated by the increase in packet loss and the overall throughput fails to show any meaningful increasing trend.
...