...
The fallowing graph shows the daily TCP throughput seen from SLAC to Al Quds, IUGaza and Palestine Standards Institution (www.psi.gov.ps)

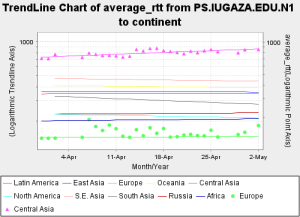
The monthly average Round Trip Times (RTTs) from Al Quds and IUGaza are shown below. The individual data points daily avergae(average_RTT) are shown to show the variability.

...