...
where:
Rate: is the TCP transfer rate or throughputd
MSS: is the maximum segment size (fixed for each Internet path, typically 1460 bytes)
RTT: is the round trip time (as measured by TCP)
p: is the packet loss rate.
In the left hand tow two graphs the data points (average throughput per month) are fitted to exponential functions and for simplicity the trend lines only are shown. These lines enable us to see that Rusia and Latin America are 6 years behind Europe, the Mid-East and SE Asia are 7 years behind, and S. Asia, C. Asia and Africa are 10 years or more behind. What is even more concerning is that Africa In particular), South and Central Asia are not catching up.
The right hand most figure shows the yearly average derived TCP throughput normalized by the minimum RTT for the region (to reduce the proximity effects). It is seen that the throughputs are not simply exponential straigh lines, but typically change in steps as major changes are made in the routing and circuits.
...
Palestine
Routes
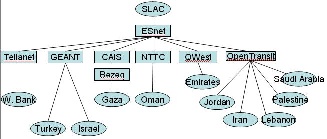
The main Autonomous System Domains (ASN) in the routes from SLAC to the Middle East countries for the sites we monitor are shown in the figure below. It can be seen that many providers are used. The Palestinian sites (Gaza and the West Bank) use different providers from each other and from the neighboring countries.
Round Trip Times, Losses and Througputs for Palestine with Various Regions
...