...
The right hand most figure shows the yearly average derived TCP throughput normalized by the minimum RTT for the region (to reduce the proximity effects). It is seen that the throughputs are not simply exponential straigh lines, but typically change in steps as major changes are made in the routing and circuits.
Palestine
Round Trip Times, Losses and Througputs
...
for Palestine with Various Regions
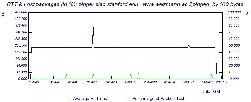
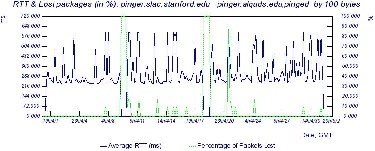
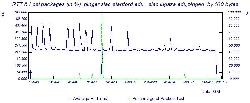
The hourly losses and RTTs seen from SLAC for Israel, Al Quds and IUGaza are shown below. It is seen that israel has almost no variability so the link is un-congested. Both the Al Quds and IUGaza time series show strong diurnal changes indication congestion/queuing during work hours. Comparing Al Quds and IUGaza it appears they have similar minimum RTTs of about 250ms. IUGaza has improved with less congestion since April 17, 2007. Al Quds had two periods of unreachability (100% loss on the green line).
...