...
This addresses the question of whether the PingER data can identify the impact of COVID-19 on the Internet. According to https://thrivenextgen.com/covid-19-impact-on-internet-performance/ Most Internet Service Providers (ISPs) oversubscribe their bandwidth and networks as typical inbound and outbound traffic are bursty and often don’t sustain high levels on a continuous basis. Fortunately, most of the larger National Providers have had sufficient time to prepare for the impact of COVID-19 and plan for the possibility of business workloads shifting to the home. Regardless of this capacity planning, Internet traffic patterns are about to change drastically based on schools across the country opting for virtual learning and business work from home migrations. Also Time Magazine April 5/ April 15 2020 reports that "traffic worldwide is up 35%...Demand is highest in the evening in the past two weeks, says networking firm Century Link."
For example, one might expect that as schools shut, people self isolate, are sent home from. work, work from home, lockdowns are imposed etc., physical person-to-person communications would migrate to the Internet and will increase the use of the Internet e.g. by virtual learning, streaming, etc. to gather information and entertain. The thought is that this will lead to different Internet patterns and possibly lead to Internet congestion. A study of the impact of COVID-19 on Internet speeds by Ookla ("TRACKING COVID-19’S IMPACT ON GLOBAL INTERNET PERFORMANCE") is directly relevant, however, it is hard to identify any dramatic impact on the latencies in the report. There is also COVID-19 impacts on Internet traffic: Seattle, Northern Italy and South Korea which looks at the impact on Internet traffic volumes. Also companies such as Netflix, Amazon, Apple, Disney, Google have reduced the quality of their videos to help reduce traffic and congestion of the Internet (see https://www.traffic-masters.net/covid19-web-traffic-statistics/).
PingER uses the ping facility to measure the Round Trip Time (RTT) between about 20 monitoring sites and target hosts in over 160 countries (over 10,000 pairs of monitor-remote(target)_sites). Every 30 minutes the monitor sends up to 30 pings at one second intervals to each target until there are 10 responses, and records the data which are daily gathered, archived, analyzed and presented at the archiving site.
...
PingER monitors two hosts in Hubei: www.hbmy.edu.cn at Hubei University for Nationalities and Hubei University of Automotive Technology and www.huat.edu.cn at the Hubei University of Automotive Technology. The locations of the two Universities is shown below.
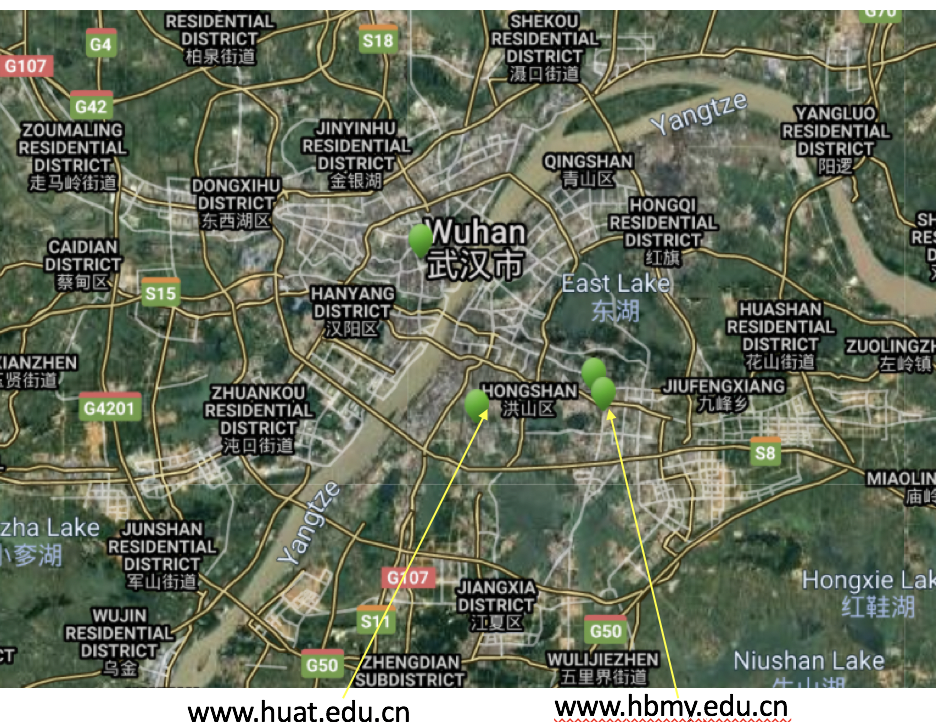
The hourly measurements measurements for www.hbmy.edu.cn and www.huat.edu.cn are shown below (one can use the form https://www.slac.stanford.edu/cgi-bin/ping_data_plot.pl to create such a plot).
...
Probably the best source of PingER data is https://www-iepm.slac.stanford.edu/pinger/prmout/ which is aggregated data for various metrics by region and time window (or tick).
Excel spreadsheets.
PingER data related to COVID-19 outbreak COVID-19 cases and deaths by country View file name covid19-pinger.xlsx height 250 View file name Log-Covid.xlsx height 250
...