| Table of Contents |
|---|
Introduction
This addresses the question of whether the PingER data can identify the impact of COVID-19 on the Internet. According to https://thrivenextgen.com/covid-19-impact-on-internet-performance/ Most Internet Service Providers (ISPs) oversubscribe their bandwidth and networks as typical inbound and outbound traffic are bursty and often don’t sustain high levels on a continuous basis. Fortunately, most of the larger National Providers have had sufficient time to prepare for the impact of COVID-19 and plan for the possibility of business workloads shifting to the home. Regardless of this capacity planning, Internet traffic patterns are about to change drastically based on schools across the country opting for virtual learning and business work from home migrations. Also Time Magazine April 5/ April 15 2020 reports that "traffic worldwide is up 35%...Demand is highest in the evening in the past two weeks, says networking firm Century Link."
...
Note that for Europe, US and Canada the Christmas/New Year season (end November thru 2nd week in January) may also be expected to change behaviors.
China and North AmericaMonitoring
The PingER monitor at SLAC, Stanford University in California currently monitors about 100 hosts in China. Using the pingtable.pl web page we selected daily aggregated data from SLAC to China for the last 365 days and looked at various metrics derived from the RTTs. Since many of the targets are Universities that may have taken lockdown measures and sent many students and staff home, we decided to look at the overall impact on SLAC to China pings. To do this we scroll down the pingtable.pl page to summary tables as shown below. 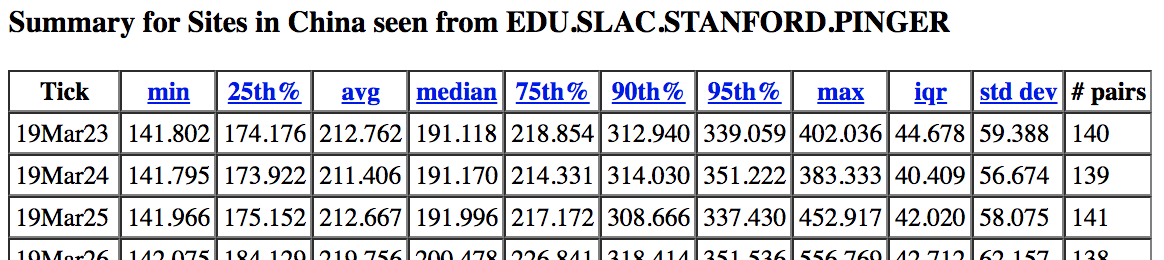
We can cut and paste this table into Excel to enable further analysis and visualization. Also the summary data is analyzed on a regular basis and the results made available as CSV files at https://www-iepm.slac.stanford.edu/pinger/prmout/. The file names (e.g.average_rtt-EDU.SLAC.STANFORD.PINGER-continent-allmonthly.csv) provide the metric (average_rtt in example), the Monitoring Agent (EDU-SLAC.STANFORD.PINGER in example), the region (continent or country) and the time window of each data point (or Tick, e.g. monthly (=last 12 months), allmonthly, or allyearly).
China and North America
Looking at the plot of daily average RTTs there is a peak (going from 145ms to 160ms) in minimum (average RTT) from Jan 10 to Jan 24th 2020, plus another spike on Feb 19.
...
A lockdown began for Northern Italy on March 8th and extended to all Italy on March 9th. A plot of the daily IPDV measured from SLAC to 6 Italian hosts together with some COVID-19 milestones is shown below. The milestones are 17 cases diagnosed Feb 21 (including first local transmissions) and 225(105 new) Feb 25. The progress of COVID-1`6 in Italy can be seen here. There are 6 Italian hosts being monitored from SLAC the values shown are the 25%, median and 75% of the daily IPDV measured for the 6 hosts for the given days.

More Information.
...