...
A timeline for COVID-19 can be found here. Also looking at a map of how the COVID-19 travelled the world or the HealthMap one can see how and when various regions were impacted. Also see Coronavirus Disease (COVID-19) – Statistics and Research and COVID-19 Coronavirus - Update for detailed statistics. Note that for Europe, US and Canada the Christmas/New Year season (end November thru 2nd week in January) may be expected to change behaviors.
...
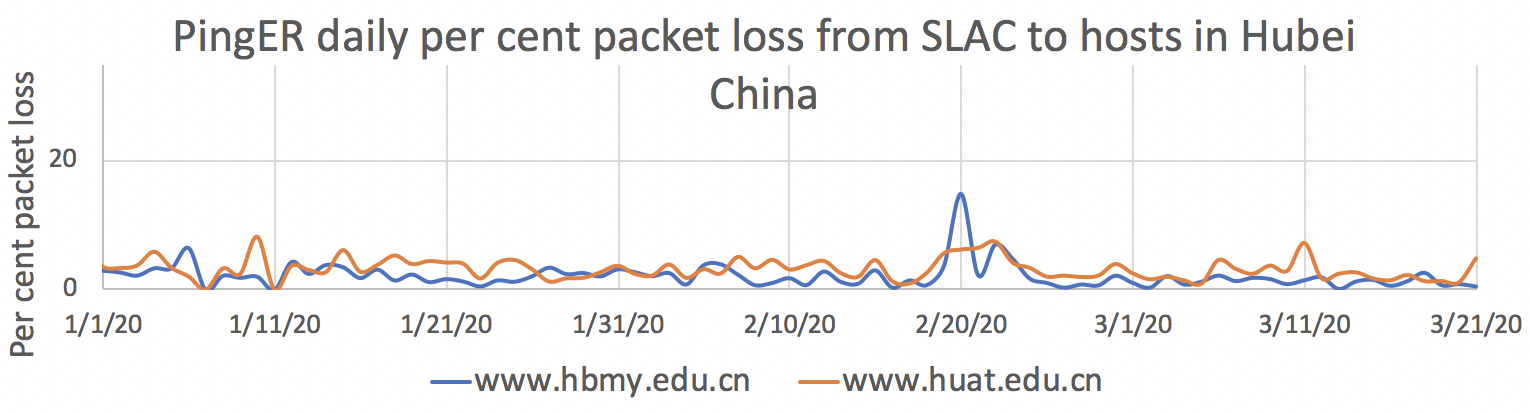
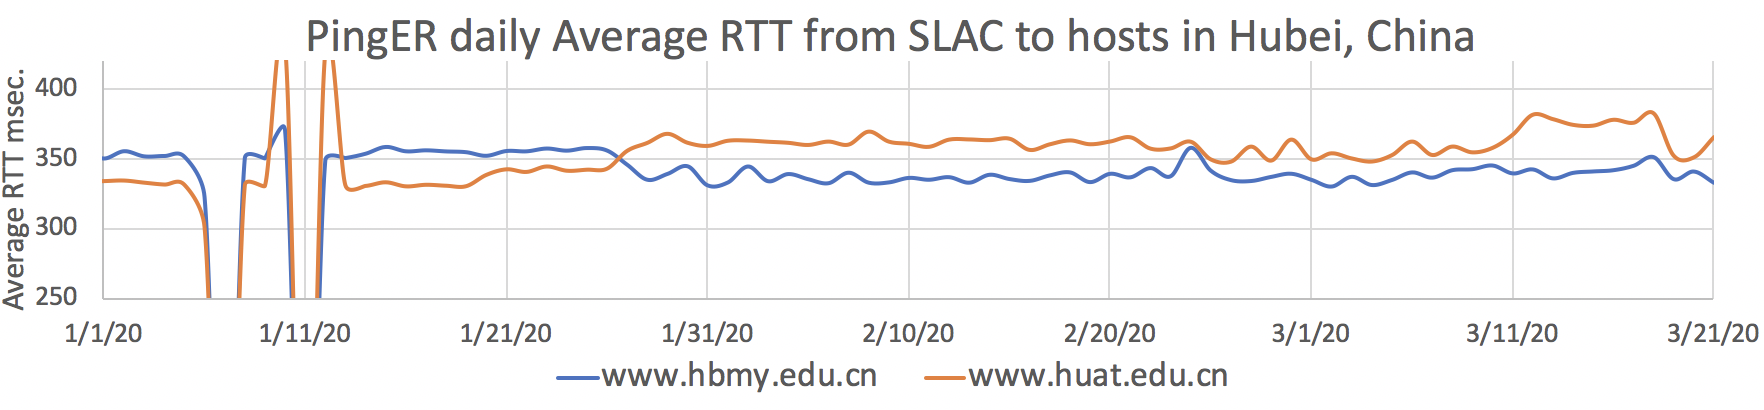
If we look at the daily aggregates for the packet loss per cent, average RTT and Inter Packet Delay Variation www.hbmy.edu.cn and www.hbuat.edu.cn from 3/23/2019 thru 3/21/2020 and then expand to see the subset from 1/1/2020 thru 3/21/2020 we get the plots below.
 |  |
 |  |
 |  |
It is clear that there are huge variations in the measurements over the last year. Looking at just 2020 data there does appear to be evidence for an almost factor of 2 change in the IPDV IPDVs towards the end of January, in opposite directions for the two hosts. N.b we might expect to see something following the January 23rd lockdown of the Wuhan region. There is a "flutter" in the IPDV around that time, whether it is related to the shutdown is unclear.
Looking at the aggregated monthly IPDVs for the two hosts we see:
...