...
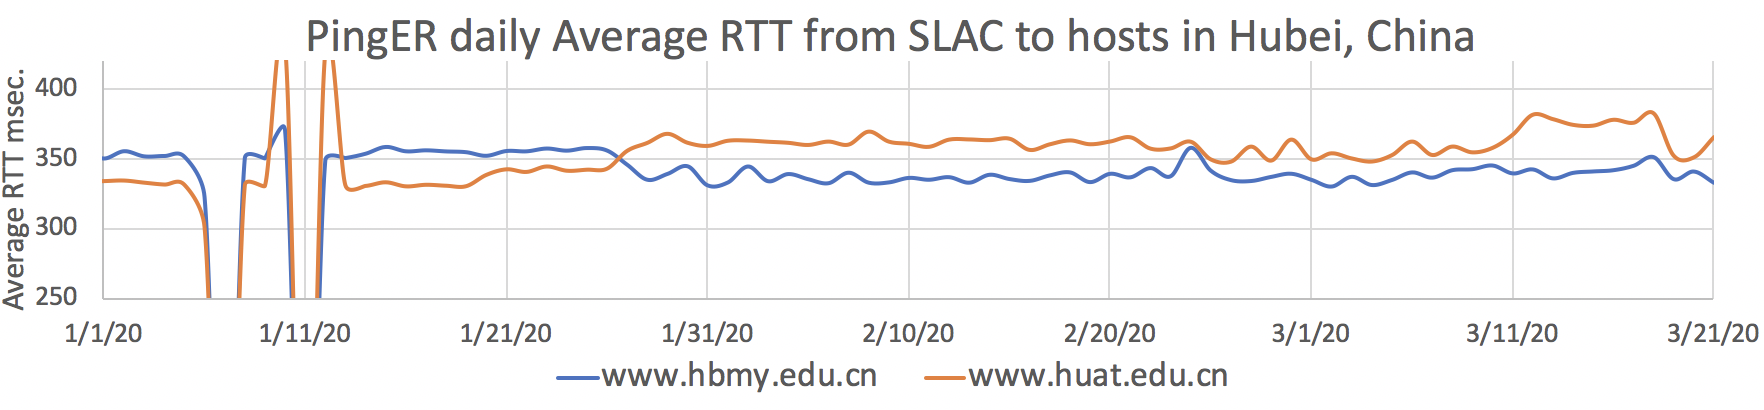
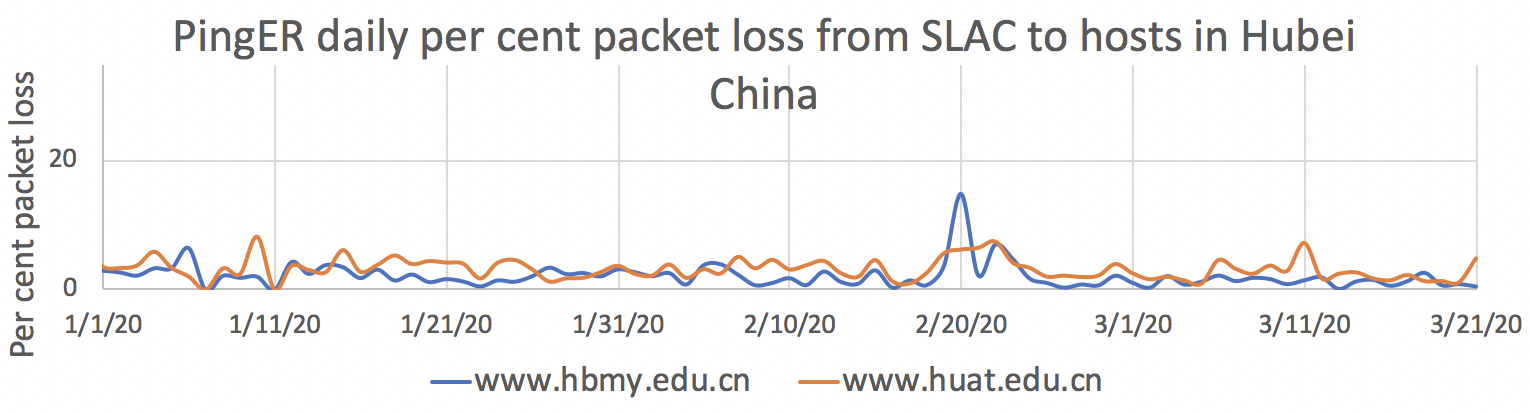
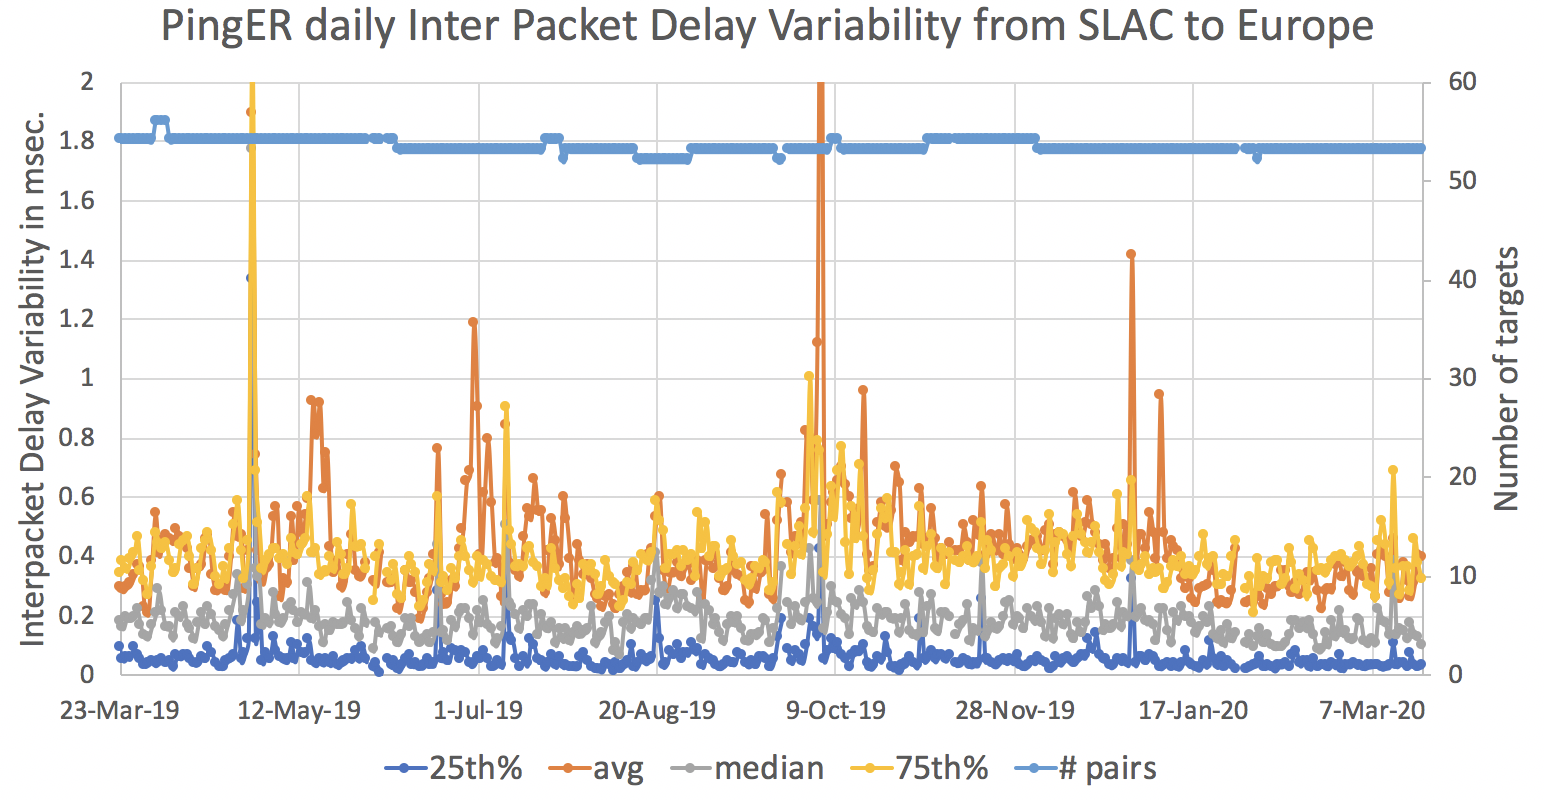
If we look at the daily aggregates for the packet loss per cent, average RTT and Inter Packet Delay Variation www.hbmy.edu.cn and www.hbuat.edu.cn from 3/23/2019 thru 3/21/2020 and then expand to see the subset from 1/1/2020 thru 3/21/2020 we get the plots below
 |   |
 | |
 |  |
It is clear that there are huge variations in the measurements over the last year. Looking at just 2020 data there does appear to be evidence for an almost factor of 2 change in the IPDV towards the end of January, in opposite directions for the two hosts.
Looking at the aggregated monthly IPDVs for the two hosts we see:

Europe
Italy jumped from three incidents on Friday, February 21 to 229 by the time of WHO’s February 25 situation report
For Italy, PingER monitors hosts 7 hosts. They are in Bologna, Udine, Rome, Pisa and Frascati. These are not the hardest hit areas (see here).
After removing one (vr1dx.fisica.uniud.it) which stopped responding on February 20, 2020 the IPDV for each of the Italian hosts appears as below:


There appears to be a dramatic drop in the IPDV for the target host speed.unidata.it in Bologna between the end of January and Feb 419h19th. Italy's first COVID-19 case was announced February 19th, thus it is doubtful this drop has anything to do with COVID-19.
A lockdown began for Northern Italy on March 8th and extended to all Italy on March 9th. A plot of the daily IPDV measured from SLAC to 6 Italian hosts together with some COVID-19 milestones is shown below. The milestones are 17 cases diagnosed Feb 21 (including first local transmissions) and 225(105 new) Feb 25. The progress of COVID-1`6 in Italy can be seen here. There are 6 Italian hosts being monitored from SLAC the values shown are the 25%, median and 75% of the daily IPDV measured for the 6 hosts for the given days.

More Information.
...