List of all plots
List of all plots for 2018
Previous week Next week
Calorimeter trending plots
Pedestals, thresholds, light asymmetry slope, and charge peaks for previous six months and mission lifetime. Pedestal quantities being trended are pedestal difference from reference epoch and pedestal rms. Thresholds are trended in MeV units for LAC, FLE, and FHE, and in ADC units for all three ranges of ULD transition.
2D histograms contain 1536 or 3072 values per time slice. Each time slice is one week. Value indicated is average over one week.
...
24-week plots
Reference epoch is Quarterly Review 3 to 6-epsilon months in the past.
...
Pedestals: 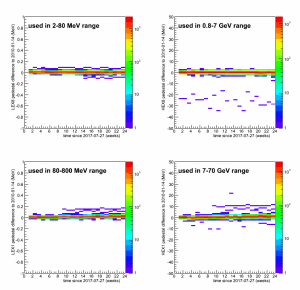
...
Pedestal widths: 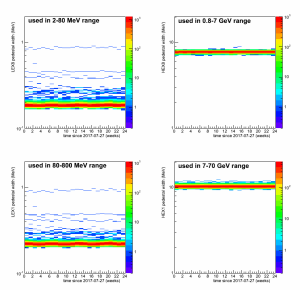
...
LAC thresholds: 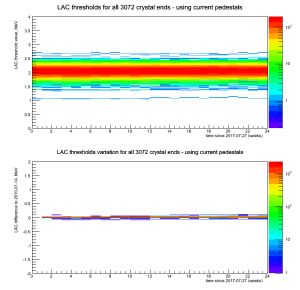
...
FLE thresholds: 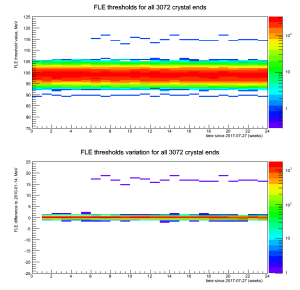
...
FHE thresholds: 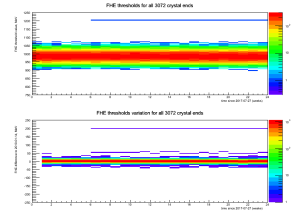
...
ULD thresholds - LEX8: 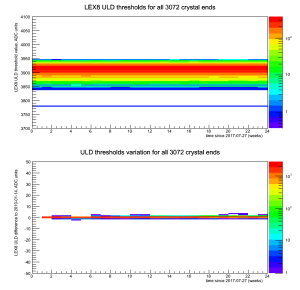
...
ULD thresholds - LEX1: 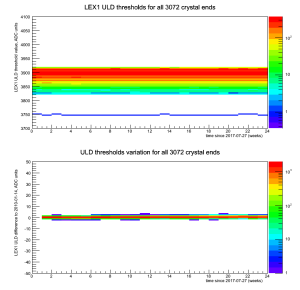
...
ULD thresholds - HEX8: 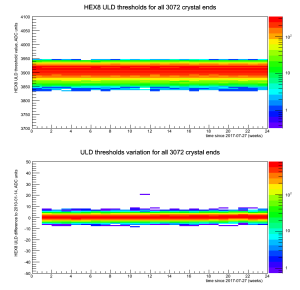
...
Mission Life Plots
...
Pedestals: 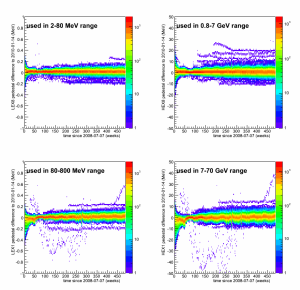
...
Pedestal widths: 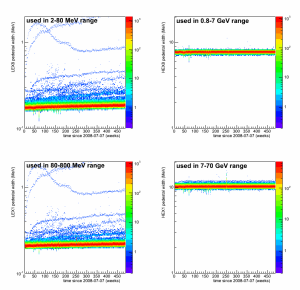
...
LAC thresholds: 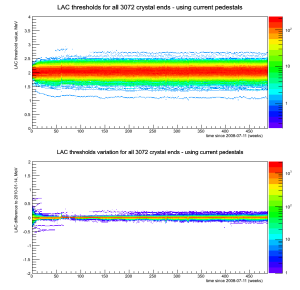
...
FLE thresholds: 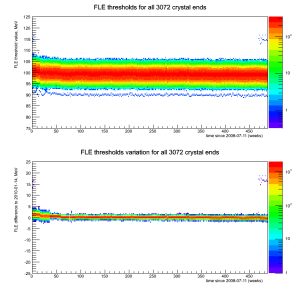
...
FHE thresholds: 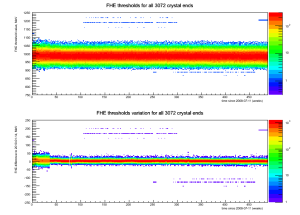
...
ULD thresholds - LEX8: 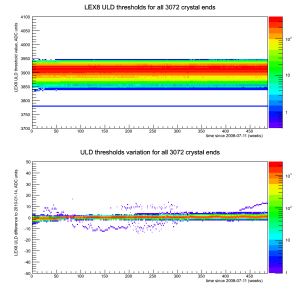
...
ULD thresholds - LEX1: 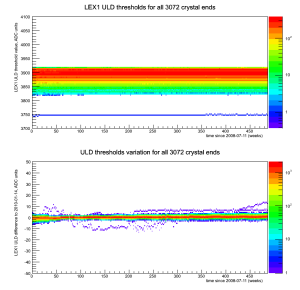
...
ULD thresholds - HEX8: 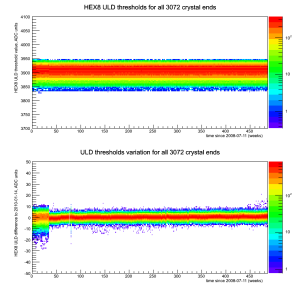
...
Averaged Values (in MJD) from David Sanchez
...
LAC pos thresholds: 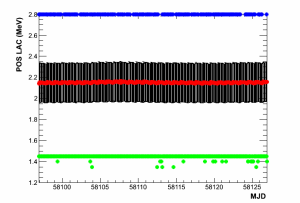
...
LAC neg thresholds: 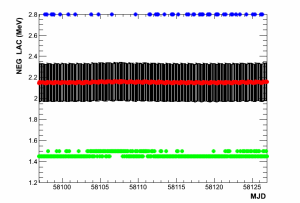
...
FLE thresholds: 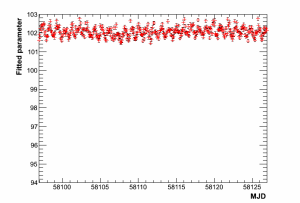
...
FHE thresholds: 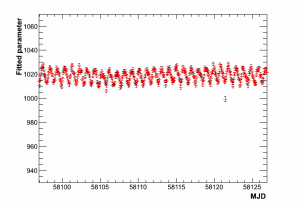
...
Mean Pedestal Deviations - LEX8: 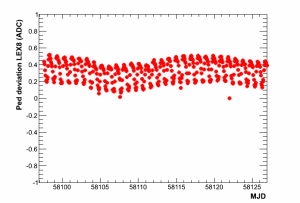 Pedestal Deviation Spread:
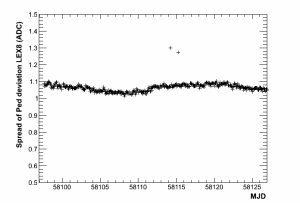
...
Mean Pedestal Deviations - LEX1: 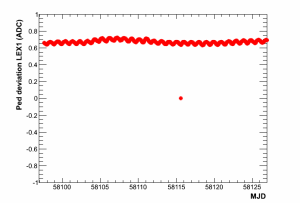 Pedestal Deviation Spread:
...
Mean Pedestal Deviations - HEX8: 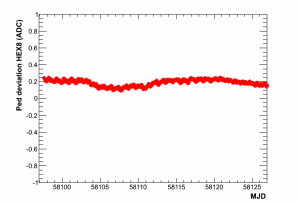 Pedestal Deviation Spread:
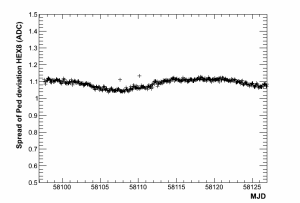
...
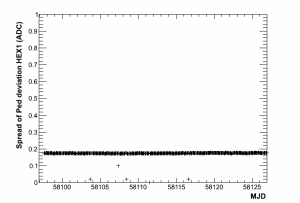
Mean Pedestal Deviations - HEX1: 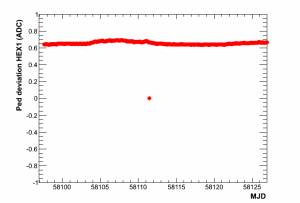 Pedestal Deviation Spread: