Page History
Contents
| Table of Contents |
|---|
Online Analysis Tutorial - presented at SSRL/LCLS User's conference, 2014
Online Analysis Design
Online Analysis Design - Presentation by Matt for January 2012 DAQ Meeting
...
| Anchor | ||||
|---|---|---|---|---|
|
AMI monitoring tool
AMI (Analysis Monitoring Interface) is a user-configurable graphical online monitoring tool that can be used to make informed decisions in response to real-time feedback during an experiment. AMI requires no user coding to produce an analysis. Each instrument is equipped with a few monitoring nodes; most instruments have 6, MEC has 4 and CXI 12. These monitoring nodes receive a fixed fraction of all events containing science data from all detectors. These events are copied to shared memory where the data are made available for monitoring applications. Users may also integrate their own code to perform even more sophisticated or device-specific processing. Analysis results are collected from each node for display to the operator.
AMI allows users to view detector images and perform tasks such as background subtraction, event filtering, and detector correlations. AMI also provides tools to perform many standard analysis tasks such as displaying corrected and raw images and waveforms, displaying data as histograms, strip charts, scatter plots, etc. and performing averaging, filtering, and other generic manipulations of the data including region of interest selection, masking, projections, integration, contrast calculation, and hit finding. The GUI has a set of simple operations that can be cascaded to achieve a variety of monitoring measures.
Multiple sessions of AMI may coexist so that users may monitor the data on different consoles and using different criteria. AMI can be used both on live and offline data without any coding.
Online Monitoring GUI
| Anchor | ||||
|---|---|---|---|---|
|
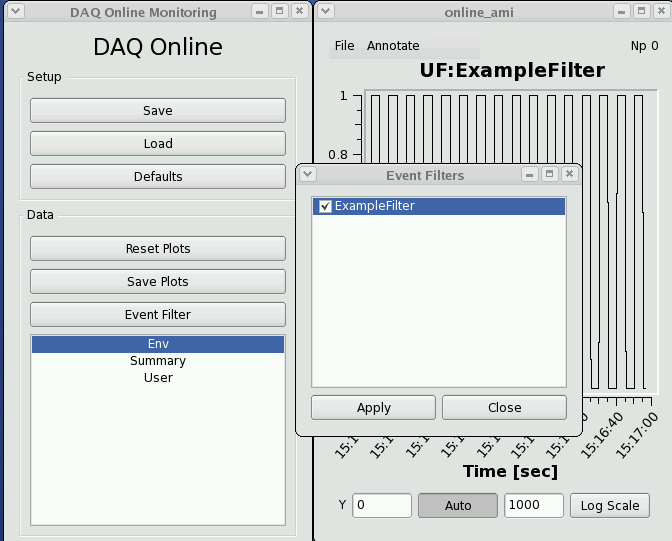
Using the Online Monitoring GUI
"Restart DAQ" icon on operator console brigns up multiple GUI panels for DAQ system. Online Monitoring GUI is as shown below:
...
| Anchor | ||||
|---|---|---|---|---|
|
Writing a plug-in to the Online Monitoring GUI
The core online monitoring can be specialized by supplying plug-in modules containing user code. These modules can
(1) compute variables to be used in the monitoring GUI,
(2) generate additional plots to be displayed, and
(3) provide a filtering decision for events to be used in the monitoring.
...
| Anchor | ||||
|---|---|---|---|---|
|
Writing a user application (reads from shared memory)
| Anchor | ||||
|---|---|---|---|---|
|
Online Monitoring and Simulation Using Files
The online monitoring system will interface the DAQ system to the monitoring software through a shared memory interface. The two sides communicate with each other via POSIX message queues. The DAQ system will fill the shared memory buffers with events which are also known as transitions. The DAQ system notifies the monitoring software that each buffer is ready by placing a message in the monitor output queue containing the index of the newly available event buffer.
...
| Anchor | ||||
|---|---|---|---|---|
|
Writing a user application, offline analysis style (reads from a file)
Each hutch has a server machine dedicated to recording a copy of the data for use of a quick turnaround file-based analysis. In the AMO hutch, this machine is named daq-amo-ana01; other hutches have similarly named machines. This machine "spies" on the data acquisition system and records all data it sees, whether or not the data acquisition system is directed to record them.
...
| Anchor | ||||
|---|---|---|---|---|
|
XTC playback
There is a DAQ Offline Monitoring program that operates just like the Online Monitoring program except that it includes an additional section at the top of the user interface that allows one to select offline runs stored in directories. To use it, log onto a machine that has access to the xtc directories you would like to use as input data. Then, run:
...
Overview
Content Tools