...
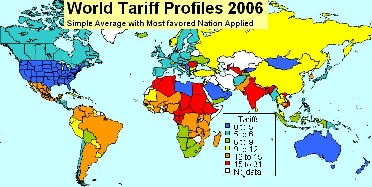
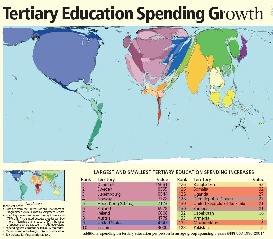
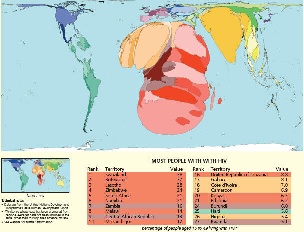
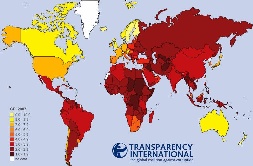
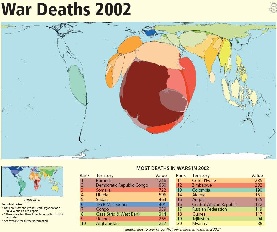
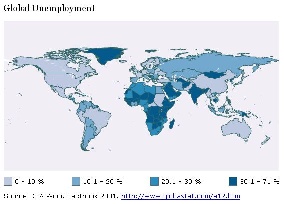
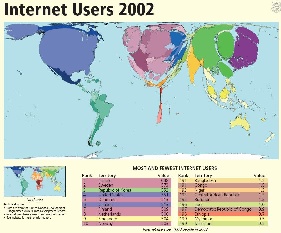
There are many reasons for this poor connectivity including: electricity (see Figure 4 for the light at night for the world and compare Africa with the rest of the world), import tariffs (see figure 5), skills (see Figure 6 for a cartogram (where territories are re-sized according to the subject of interest - all cartograms shown here are from http://www.worldmapper.org/) of tertiary education spending growth), disease (Figure 7), protectionist policies, corruption (see Figure 8), conflict (see Figure 9) and , unemployment (see figure 10) and brain drain.
Figure 4: World light at night | Figure 5: World Tariff Profiles | Figure 6: |
|---|---|---|
| | |
Figure 7: HIV Prevalence | Figure 8: Corruption Perception Index | Figure 9: |
| | |
Figure 10: Global Unemployment 2007 |
|
|
|

...
Figure 11a: | Figure 11b: | Figure 11c: |
|---|---|---|
| | |
Capacity
International International capacity to African countries is mainly provided via satellite or via fibre links. Satellite links are not only much more expensive (300-1000 times) in terms of $/Mbps but they also induce long delays of over 400mseconds that result in lack of interactivity and poor performance. However in 2004 only 14 of 49 sub-Saharan countries had access to fibre according to NEPAD. In fact as seen in Figure 12:
...
The ATICS survey of 84 leading tertiary institutions in Africa found 850,000 students and staff with access to a total of only 100Mbps international bandwidth. By contrast, Australia's tertiary community of 250,000 share 6Gbps of international bandwidth (although even this is still insufficient to meet their needs).
Costs
Wiki Markup
Figure 14a: 2002 | Figure 14b: | Figure 14c: GDP/capita for 2006 |
|---|---|---|
| |
|
Market Research conducted by Paul Budde Communications indicates that 1 year of Internet access is greater than the annual income of most Africans. Only in Egypt, Libya, and Mauritius is the annual cost of Internet access < 10% of the annual income. A study on Promoting African Research & Education Networking (PAREN), sponsored by IDRC, in Jan 2005 showed that African universities pay on average 50 times more for bandwidth than, for example, U.S. universities ($5.46/ Kbps/month vs. $0.12/Kbps/month). W. Africa pays on average $8/Kbps/month, and N Africa $0.52/Kbps/month. An OECD study on Broadband in November 2007 showed a median for OECD countries of $16/Mbps/month with Japan at $3.09/Mbps/month. Even a recent Bandwidth Initiative by a c alition coalition of 11 African Universities (MZ, TZ, UG, GH, NG, KY) + four major US Foundations to provide satellite through Intelsat though it reduced the costs by a factor of three they are still at $2.23K/Mbps/month. Thus Africans are paying hundreds of times what is being paid by residences in OECD countries.
...
GEANT has connections to EuMed in particular Marocco, Algeria, Tunisa and Egypt, see http://www.dante.net/upload/pdf/EUMED-poster.pdf . They are now working on connecting to Ubuntunet East and Ubuntunet South.
Also the UN, governments such as China, the UK, Europe, the US and companies such as AMD, Intel,Microsoft, Cisco, Nokia and Ericsson are recognizing the opportunities and needs and investing. This will introduce challenges of new development models such as more inclusive business models; bottom-up approach; working in new regulatory, policy and poor infrastructural availability environments; working with governments and others to ensure fibres are installed with any major relevant projects (railways, roads, electricity pylons etc.); micro-payments; content in many new local languages; use of wireless for last mile connections; Internet kiosks and cafes, etc.
Though there are currently (2007) only 3 NRENs (Kenya/KENET, Malawi/MAREN, and South Africa/TENET) in Sub-Saharan Africa, another 9 are under construction.
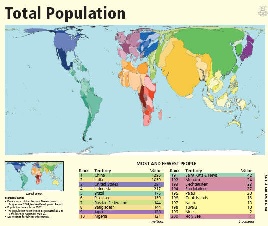
Finally, Africa has a very young population:
Despite the general trend toward population ageing, countries that still have relatively high fertility will have a younger population than the rest by 2050. Mostly least developed countries are in this group. In 2050, the youngest populations will be found in 11 least developed countries whose median ages are projected to be at or below 23 years. These countries include Angola, Burundi, Chad, the Democratic Republic of Congo, Equatorial Guinea, Guinea-Bissau, Liberia, Niger and Uganda. Today, the median age in Mali, Niger and Uganda is16 years or less, making their populations the youngest in the planet.
...
From "World Population Prospects, The 2004 Revision" UN available at: \ [http://www.un.org/esa/population/publications/WPP2004/2004Highlights_finalrevised.pdf\|
[
http://www.un.org/esa/population/publications/WPP2004/2004Highlights_finalrevised.pdf]\]
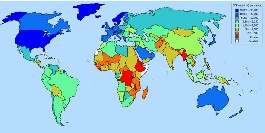
This is illustrated in the map in figure 15b where the data is from the UN "World Population Prospects, The 2004 Revision".
...
Worldwide Comparison
| Include Page | ||||
|---|---|---|---|---|
|
MOS for various Regions
| Include Page | ||||
|---|---|---|---|---|
|
Information on Calculation MOS can be found at http://www.slac.stanford.edu/comp/net/wan-mon/tutorial.html#mos
TCP throughput from CERN & SLAC to World Regions
| Include Page | ||||
|---|---|---|---|---|
|
PingER Metrics for Africa
...
The figure below shows the correlation between International bandwidth Inn Figure 12) and the normalized derived PingER throughput. It can be seen that the correlation is good (R 2
~ 0.59). It is also seen that the African countries (in Magenta) lie towards the bottom left where both the throughput and International Bandwidth are low. Libya is an anomaly since the only site monitored there is the email server for the Libya Telecommunications which should have good connectivity compared to most sites in Libya.
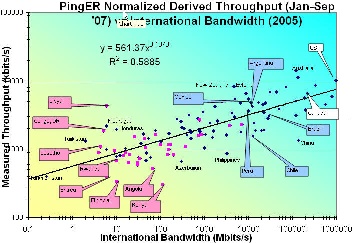
To verify whether the order of magnitude of the normalized derived throughput is correct we compare it with the Speedtest results from www.zdnet.com.au/broadband/results.htm. This application sends a known amount of data between your computer and servers in Australia. Then it measures throughput and besides returning the result to the user, it also saves and makes available the results by country and ISP. The correlation is shown in the figure below. The orders of magnitude of the two methods agree and there is a strong correlation. As expected the African countries have the poorest results.
...
Some Examples of the Impact
| Include Page | ||||
|---|---|---|---|---|
|
In 2006, the ATICS survey of 84 leading tertiary institutions in Africa found 850,000 students and staff with access to a total of only 100Mbps international bandwidth. By contrast, Australia's tertiary community of 250,000 share 6Gbps of international bandwidth (although even this is still insufficient to meet their needs).
...
Possible Remedies
| Include Page | ||||
|---|---|---|---|---|
|
Conclusions
- Poor performance affects data transfer, multi-media, VoIP, IT development & country performance / development.
- DD exists between regions, within regions, within countries, rural vs cities, between age groups.
- Decreasing use of satellites, expensive, but still needed for many remote countries in Africa and C. Asia.
- Last mile problems, and network fragility.
- International Exchange Points (IXPs) needed.
- Internet performance (non subjective, relatively easy/quick to measure) measured by PingER correlates strongly with economic/technical/development indices.
- Increase coverage of monitoring to understand Internet performance and validate improvements.
- Africa worst by all measures (throughput, loss, jitter, DOI, international bandwidth, users, costs etc.) and falling further behind.
...
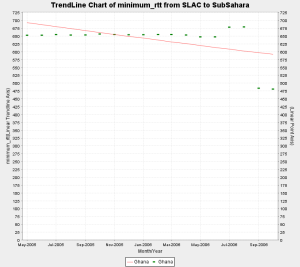
- Very recent data for Ghana i.e. (Sep and Oct 2006) inidcates a shift from satellite to fiber. In particular if we examine the individual hosts we monitor in Ghana, one of the hosts shows a step change from 680+ ms to 260+ms, while the other still continues to show satellite indicating that part of the coutry may be shifting to fibre. Further more when we looked up the asn on both the hosts, the asn for host performing poorly was described as INTELSAT while the host which is now performing better had an ASN description of "UNSPECIFIED, NETWORK COMPUTER SYSTEMS, ACCRA GHANA".
- There was a step change in the min RTT of Eritrea from 625 ms to 700 ms approx. in Sep, 2004.
...
ICT in Africa: a Status Report, Mike Jensen
West Africa Submarine cable Connection
Web Atlas of Regional Integration in West Africa
African Scientific Network
African Universities
Columbia University Africa Studies
Lowering the Cost of Internet Access in Africa
The bandwidth Initiative: Opening the power of the Internet to African Universities, Anna Bon
Can the Internet in tertiary education in Africa contribute to social and economic development?
University of Zambia Status.
Submarine Cables
Africa's New Satellite Rascom-1
International Workshop on African Research & Education Networking September 25-27 2005 CERN - Geneva, Switzerland
Orange to link Madagascar to broadband internet