...
The following Case Study of Sub-Saharan Africa was put together following the presentation at the "2nd IHY-Africa Workshop" 11-16 November 2007, Addis Ababa, Ethiopia,
and the presentation at the "Internet & Grids in Africa: An Asset for African Scientists for the Benefit of African Society", 10-12 December 2007, Montpellier, France. It contains most of the information presented plus much more background information.
African Situation
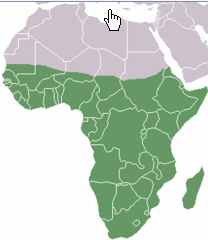
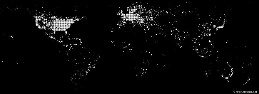
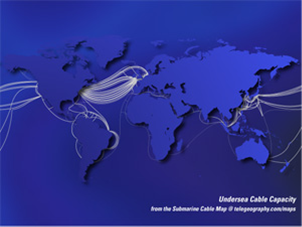
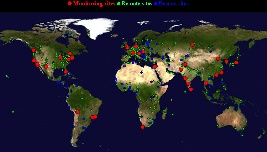
Internet coverage and performance in the Sub Sahara region of Africa (see Figure 1, for the UN definition of the Sub-Sahara) is exceedingly poor. This is illustrated by the number of Internet connections per city worldwide seen in Figure 2 where it is seen that Africa stands out as almost lacking any (i.e. it is dark). Figure 3 illustrates how Africa has very little submarine cable connectivity (white lines) compared to the rest of the world.
We first discuss the current situation including infrastructure, capacity, costs and opportunities. We then discuss the Internet performance measured by PingER comparing Africa to the rest of the world, and between sub-regions in Africa. We compare PingER measurements with other measures for capacity and throughput and for different development and corruption indices. We also look at the routing and bandwidth utilization in Africa. We then go on to show some examples of the effect of the poor African performance and suggest some possible remedies. Finally we wind up with some conclusions. Appendices are included: on detailed measurements and routing per country; and further useful reading.
African Situation
Internet coverage and performance in the Sub Sahara region of Africa (see Figure 1, for the UN definition of the Sub-Sahara) is exceedingly poor. This is illustrated by the number of Internet connections per city worldwide seen in Figure 2 where it is seen that Africa stands out as almost lacking any (i.e. it is dark). Figure 3 illustrates how Africa has very little submarine cable connectivity (white lines) compared to the rest of the world.
Figure 1: UN Definition of Sub-Sahara | Figure 2: World Internet Connection Density | Figure 3: Submarine Cables 2007 | Figure 1: UN Definition of Sub-Sahara | Figure 2: World Internet Connection Density | Figure 3: Submarine Cables 2007, from telegeography.com |
| | |
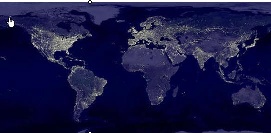
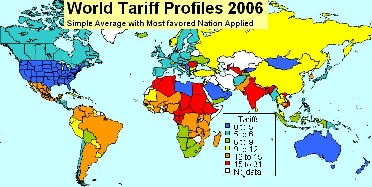
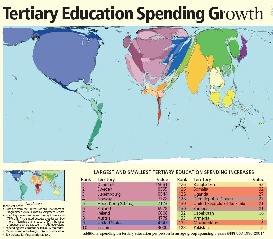
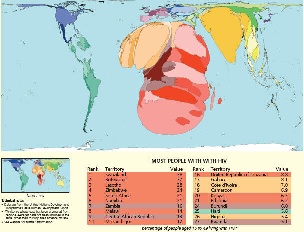
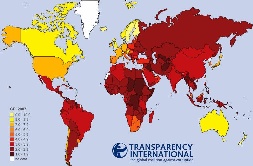
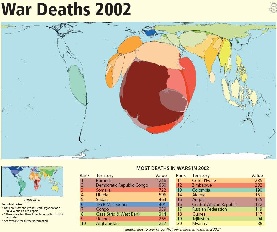
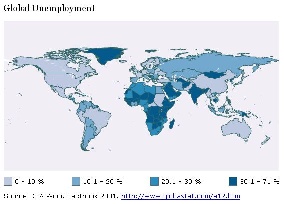
There are many reasons for this poor connectivity including: electricity (see Figure 5 4 for the light at night for the world and compare Africa with the rest of the world), import dutiestariffs (see figure 5), skills (see Figure 6 for a cartogram (where territories are re-sized according to the subject of interest - all cartograms shown here are from http://www.worldmapper.org/) of tertiary education spending growth), disease (Figure 7), protectionist policies, corruption (see Figure 8), conflict (see Figure 9), unemployment (see figure 10) and brain drain.
Figure 54: World light at night | Figure 5: World Tariff Profiles | Figure 6: | ||
|---|---|---|---|---|
| | | ||
Figure 7: HIV Prevalence | Figure 8: Corruption Perception Index | Figure 9: | ||
| |
| | |
Figure 10: Global Unemployment 2007 |
|
| ||
|
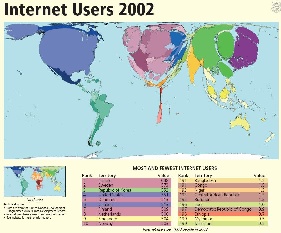
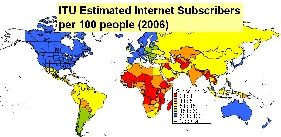
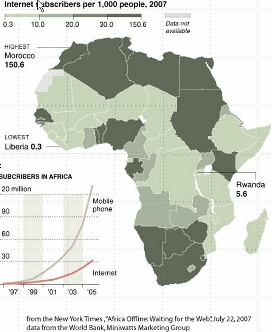
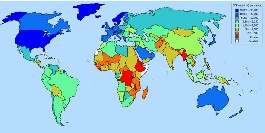
Another way of looking at the poor situation in Africa is to look at Figure 1011, illustrating the lack of Internet users in Africa compared to the rest of the world. At the bottom left of figure 10c 11c is shown the growth of Internet users and cell phone subscribers. This may suggest that cell phone infrastructure may be a very valuable way to leverage Internet growth.
Figure 10a11a: | Figure 10b11b: | Figure 10c11c: |
|---|---|---|
| | |
Capacity
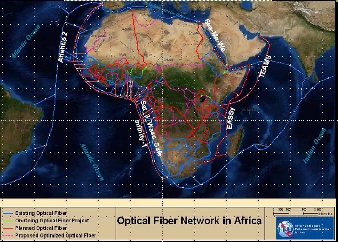
International International capacity to African countries is mainly provided via satellite or via fibre links. Satellite links are not only much more expensive (300-1000 times) in terms of $/Mbps but they also induce long delays of over 400mseconds that result in lack of interactivity and poor performance. However in 2004 only 14 of 49 sub-Saharan countries had access to fibre according to NEPAD. In fact as seen in Figure 1112:
Figure 1112: Fibre links to and within Africa and the locations of universities | Figure 1213: |
|---|---|
| |
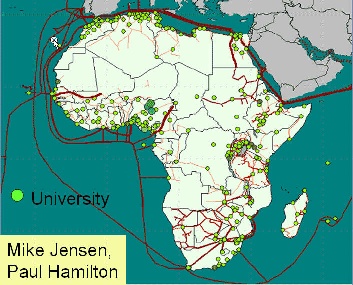
There is only one large-scale intercontinental fibre fiber link to Sub-Saharan Africa (SAT-3/WASC/SAFE) which provides connections to Europe (via Portugal) and the Far East for eight countries (Senegal, Ivory Coast, Ghana, Benin, Nigeria, Cameroon, Gabon and Angola) along the West Coast of the Continent and south to the Cape in South Africa. A second segment, in the Indian Ocean, connects South Africa to Malaysia while passing through Mauritius and India (SAFE). Jointly funded by 36 members and spearheaded by South African Telkom which invested US$85 million for a 13 per cent stake, the project cost about US$650 million dollars. The ownership of the cable was established as a club consortium, which is a confidential shareholder agreement about which little is known (despite efforts by the South African government to release the details). The cable was expected to lead to much reduced international bandwidth costs, but so far this has not occurred due to the business models used to develop the project. Even the few countries that have access to international fibre fiber through SAT-3 are not seeing the benefits because it is operated as a consortium where connections are charged at monopoly prices by the state owned operators which still predominate in most of Africa, and in many other developing regions. Landlocked African operators who have tried to purchase international fibre capacity directly from one of the consortium's international members have found themselves being charged as much to reach the SAT-3 landing point as they were charged to get from the landing station to Portugal. Sadly, the high costs have made it cheaper to send the traffic directly by satellite, even for SAT-3 shareholders such as Telecom Namibia, which has no landing point of its own. Except for some onward links from South Africa to its neighboursneighbors, and from Sudan to Egypt and from Senegal to Mali, the remaining 33 African countries are unconnected to the global optical backbones, and depend on the much more limited and high-cost bandwidth from satellite links.
Mike Jensen
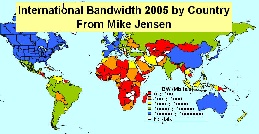
In fact SAT-3 prices have barely come down since it began operating in 2002 and are sold at satellite prices of $4-8K/Mbps/mo even though the capacity is only 5% used. As a result the lack of fibre fiber and lack of competition on SAT-23, international bandwidth to African countries, as seen in Figure 12 13 lags well behind most of the rest of the world.
It should also be pointed out that the fact there is only one fibre fiber optic cable means the only backup is satellite which may not be configured to take the re-0reouted traffic, and in any case may have inadequate capacity.
The ATICS survey of 84 leading tertiary institutions in Africa found 850,000 students and staff with access to a total of only 100Mbps international bandwidth. By contrast, Australia?'s tertiary community of 250,000 share 6Gbps of international bandwidth (although even this is still insufficient to meet their needs).
Costs
...
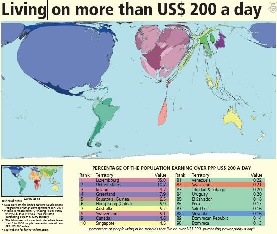
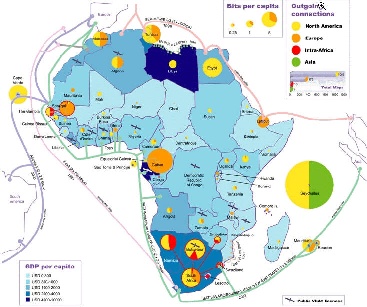
One result and immediate cause of this is the cost of this are costs of Internet connections in Africa and how they relate to income (Compare Figure 13a and 13b) and affordability. For example "Currently \[2007\] prices on SAT-3 are up to US$15 000 / 14a and 14b) and affordability. For example "Currently [2007] prices on SAT-3 are up to US$15,000 / Mbps/month, while it is estimated to cost the consortium only about US$300/Mbps/month". From a posting by Dewayne Hendricks on Dave Farber's Iper list \ -\- Bill St Arnaud. Figure 13c 14c (from Mike Jensen) shows the GDP per capita in 2006.
Figure 13a14a: 2002 | Figure 13b14b: | Figure 13c14c: GDP/capita for 2006 |
|---|---|---|
| |
|
Market Research conducted by Paul Budde Communications indicates that 1 year of Internet access is greater than the annual income of most Africans. Only in Egypt, Libya, and Mauritius is the annual cost of Internet access < 10% of the annual income. A study on Promoting African Research & Education Networking (PAREN), sponsored by IDRC, in Jan 2005 showed that African universities pay on average 50 times more for bandwidth than, for example, U.S. universities ($5.46/ Kbps/month vs. $0.12/Kbps/month). W. Africa pays on average $8/Kbps/month, and N Africa $0.52/Kbps/month. An OECD study on Broadband in November 2007 showed a median for OECD countries of $16/Mbps/month with Japan at $3.09/Mbps/month. Even a recent Bandwidth Initiative by a c alition coalition of 11 African Universities (MZ, TZ, UG, GH, NG, KY) + four major US Foundations to provide satellite thru through Intelsat though it reduced the costs by a factor of three they are still at $2.23K/Mbps/month. Thus Africans are paying hundreds of times what is being paid by residences in OECD countries.
Opportunities
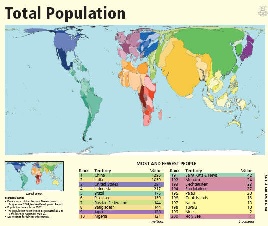
In 2006 Africa had reached close to 1 billion people or about 14% of the world's population. Its The Internet usage is also growing faster than the rest of the world. However, the Internet penetration shown in the table below is only about 3.6% so it is a huge potential market.
...
At the same time there are promises of considerably increased fibre connectivity to sub-Saharan Africa, see figure 1415a. In fact, four major undersea cable projects are currently engaged in a race to be the first to lay a fibre-optic link connecting the eastern seaboard of Africa to the rest of the world, with the most vicious competition centering on the connections to Europe, which is the destination for 85 per cent of international bandwidth traffic in Africa. The four projects are the East African Submarine Cable System (Eassy), Seacom, TEAMS and Reliance of India. The goal is to have these cables in place in time for the Soccer World Cup in South Africa in 2010.
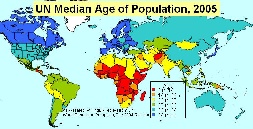
Figure 1415a: | Figure 15b: Median Population age |
|---|---|
| |
GEANT has connections to EuMed in particular Marocco, Algeria, Tunisa and Egypt, see http://www.dante.net/upload/pdf/EUMED-poster.pdf . They are now working on connecting to Ubuntunet East and Ubuntunet South.
Also the UN, governments such as China, the UK, Europe, the US and companies such as AMD, Intel,Microsoft, Cisco, Nokia and Ericsson are recognizing the opportunities and needs and investing. This will introduce challenges of new development models such as more inclusive business models; bottomsbottom-up approach; working in new regulatory, policy and poor infrastructural availability environments; working with governments and others to ensure fibres are installed with any major relevant projects (railways, roads, electricity pylons etc.); micro-payments; content in many new local languages; use of wireless for last mile connections; Internet kiosks and cafes, etc.); micro-payments; content in many new local languages; use of wireless for last mile connections; Internet kiosks and cafes, etc
Though there are currently (2007) only 3 NRENs (Kenya/KENET, Malawi/MAREN, and South Africa/TENET) in Sub-Saharan Africa, another 9 are under construction.
Finally, Africa has a very young population:
Despite the general trend toward population ageing, countries that still have relatively high fertility will have a younger population than the rest by 2050. Mostly least developed countries are in this group. In 2050, the youngest populations will be found in 11 least developed countries whose median ages are projected to be at or below 23 years. These countries include Angola, Burundi, Chad, the Democratic Republic of Congo, Equatorial Guinea, Guinea-Bissau, Liberia, Niger and Uganda. Today, the median age in Mali, Niger and Uganda is16 years or less, making their populations the youngest in the planet.
From "World Population Prospects, The 2004 Revision" UN available at: [http://www.un.org/esa/population/publications/WPP2004/2004Highlights_finalrevised.pdf|
http://www.un.org/esa/population/publications/WPP2004/2004Highlights_finalrevised.pdf]
This is illustrated in the map in figure 15b where the data is from the UN "World Population Prospects, The 2004 Revision".
PingER and Internet Performance in Africa Africa
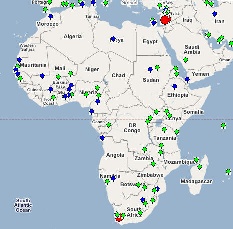
The PingER project is arguably the most extensive active end-to-end Internet performance measurement project today. It Its data goes back over a decade and more recently has focused on measuring the Digital Divide. It covers measurements from over 16 countries to over 150 countries (see Figure 1516) containing over 99% of the world's Internet connected population. 45 of the countries are in Africa.
Figure 15a16a: PingER Deployment Dec 2007, red are monitoring sites, blue beacons that are monitored from most monitoring sites and green the monitored only sites. | Figure 15b16b: Google map of African sites Dec 07 |
|
|---|---|---|
| |
Worldwide Comparison
| Include Page | ||||
|---|---|---|---|---|
|
MOS for various Regions
| Include Page | ||||
|---|---|---|---|---|
|
Information on Calculation MOS can be found at http://www.slac.stanford.edu/comp/net/wan-mon/tutorial.html#mos
TCP throughput from CERN & SLAC to World Regions
| Include Page | ||||
|---|---|---|---|---|
|
PingER Metrics for Africa
...
One way of showing how Africa is behind the rest of the world from the point of view of PingER Internet measures is to show compare maps of the performance for several metrics for January through September 2007. These are shown in the Figures below.
...
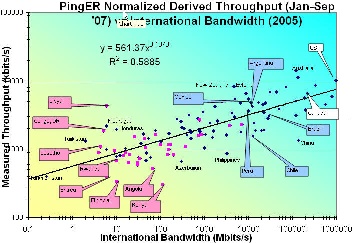
The figure below shows the correlation between International bandwidth Inn Figure 12) and the normalized derived PingER throughput. It can be seen that the correlation is good (R 2
~ 0.59). It is also seen that the African countries (in Magenta) lie towards the bottom left where both the throughput and International Bandwidth are low. Libya is an anomaly since the only site monitored there is the email server for the Libya Telecommunications which should have good connectivity compared to most sites in Libya.
To verify whether the order of magnitude of the normalized derived throughput is correct we compare it with the Speedtest results from www.zdnet.com.au/broadband/results.htm. This application sends a known amount of data between your computer and servers in Australia. Then it measures throughput and besides returning the result to the user, it also saves and makes available the results by country and ISP. The correlation is shown in the figure below. The orders of magnitude of the two methods agree and there is a strong correlation. As expected the African countries have the poorest results.
...
Looking at the figure below of the routing from the best connected country in Sub Saharan Africa, i.e. South Africa to the rest of Africa in 2005 it is seen that aprt from to Zimbabwe and Botswana traffic was routed via other continents. Not only does this increase costs but it means that In essence the African community is subsidizing the international carriers.
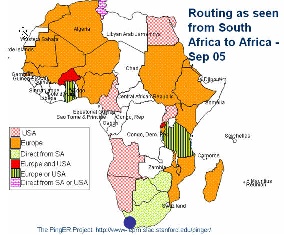
What One thing that is needed is to put into place International eXchange Points (IXPs) between countries to reduce costs and improve performance. This requires users (universities, countries) to band together to leverage influence, get deals etc. There is evidence of this happening in Ubuntunetand the Bandwidth Initiative referred to above. Further the successful launch on December 28 2007 of the RASCOM-1 (named after its parent operator the Regional African Satellite Corporation) is expected to cut costs by providing competition, provide inter-urban links, provide broadband for rural areas, and provide directs links between all African countries.
users (universities, countries) to band together to leverage influence, get deals etc. There is evidence of this happening in Ubuntunetand the Bandwidth Initiative referred to above. However, current providers (cable and satellite) have a lot to loose and many of these have close links to regulators and governments (e.g. over 50% of ISPs in Africa are government controlled), so this will be difficult in many cases and may require government intervention. Also the regulatory regimes on the whole are closed and resistant to change, and sometimes ISPs themselves are unwilling to co-operate
Some Examples of the Impact
A survey by Les Cottrell and Monique Petitdidier at the IHY meeting Ethiopia in November 2007 of leading Universities in 17 countries showed the following:
...
themselves are unwilling to co-operate
Some Examples of the Impact
| Include Page | ||||
|---|---|---|---|---|
|
...
In 2006, the ATICS survey of 84 leading tertiary institutions in Africa found 850,000 students and staff with access to a total of only 100Mbps international bandwidth. By contrast, Australia's tertiary community of 250,000 share 6Gbps of international bandwidth (although even this is still insufficient to meet their needs).
...
Possible Remedies
| Include Page | ||||
|---|---|---|---|---|
|
Conclusions
- Poor performance affects data transfer, multi-media, VoIP, IT development & country performance / development.
- DD exists between regions, within regions, within countries, rural vs cities, between age groups?.
- Decreasing use of satellites, expensive, but still needed for many remote countries in Africa and C. Asia.
- Last mile problems, and network fragility.
- International Exchange Points (IXPs) needed.
- Internet performance (non subjective, relatively easy/quick to measure) correlate measured by PingER correlates strongly with economic/technical/development indices.
- Increase coverage of monitoring to understand Internet performance and validate improvements.
- Africa worst by all measures (throughput, loss, jitter, DOI, international bandwidth, users, costs etc.) and falling further behind.
Appendix A: Interesting Trends:
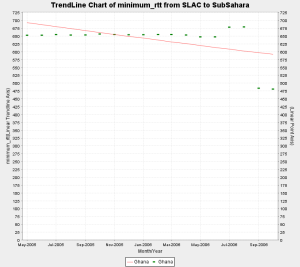
- Sudan shifted from average RTT of approx. 685 ms to approx. 260 ms in Nov 2004. This is a classic case of shift from Satellite to Fiber. However there is are no remarkable trends visible in the throughput. This is explained by the increase in packet loss over the same period of time. Thus the improvement in rtt was compensated by the increase in packet loss and the overall throughput fails to show any meaningful increasing trend.
...
- Very recent data for Ghana i.e. (Sep and Oct 2006) inidcates a shift from satellite to fiber. In particular if we examine the individual hosts we monitor in Ghana, one of the hosts shows a step change from 680+ ms to 260+ms, while the other still continues to show satellite indicating that part of the coutry may be shifting to fibre. Further more when we looked up the asn on both the hosts, the asn for host performing poorly was described as INTELSAT while the host which is now performing better had an ASN description of "UNSPECIFIED, NETWORK COMPUTER SYSTEMS, ACCRA GHANA".
- There was a step change in the min RTT of Eritrea from 625 ms to 700 ms approx. in Sep, 2004.
...
An interesting way to analyze the state of internet connectivity in Africa is to look at colored maps of various metrics as seen from our monitoring node in South Africa. 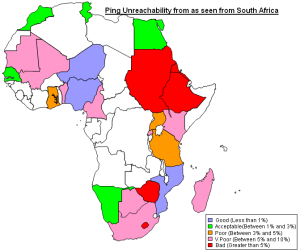
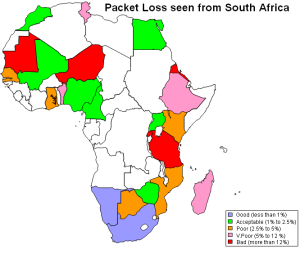
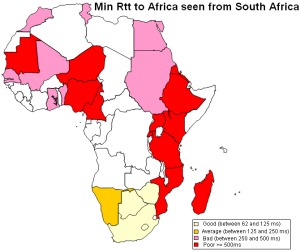
Ping Unreachability Packet Loss Min_rtt
Routing in Africa seen from SLAC
Using programs written to analyze traceroutes for different regions we have been able to generate topology maps of various regions in Africa as seen from SLAC. These maps provide a valuable insight into the various ASNs that are encountered as packets are routed from SLAC to Africa.
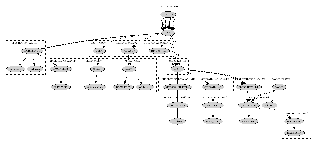

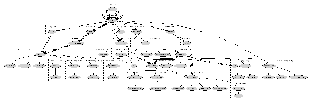
SLAC to West Africa SLAC to South Africa SLAC to East Africa
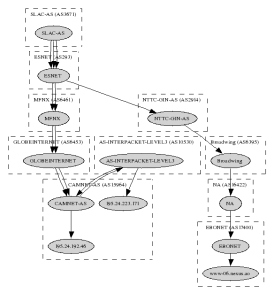
SLAC to Central Africa
Appendix B: Useful Links
ICT in Africa: a Status Report, Mike Jensen
West Africa Submarine cable Connection
Web Atlas of Regional Integration in West Africa
African Scientific Network
African Universities
Columbia University Africa Studies
Lowering the Cost of Internet Access in Africa
The bandwidth Initiative: Opening the power of the Internet to African Universities, Anna Bon
Can the Internet in tertiary education in Africa contribute to social and economic development?
University of Zambia Status.
Submarine Cables
Africa's New Satellite Rascom-1
International Workshop on African Research & Education Networking September 25-27 2005 CERN - Geneva, Switzerland
Orange to link Madagascar to broadband internet