Page History
...
- makes a map of local maximums of requested rank for data ndarray using mask,
- for each peak candidate defines the number of pixels, total intensity in the region defined by rank radius evaluates background level, rms of noise, and S/N using parameters {{
r0=5.0, dr=0.05}} - apply peak selection parameters, for example
...
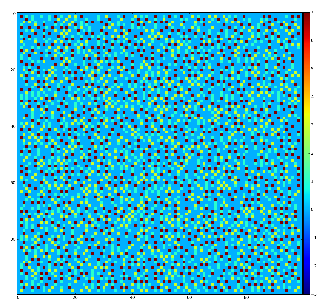
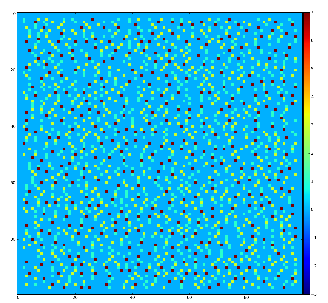
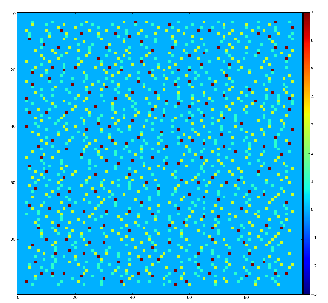
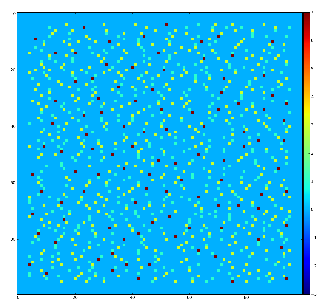
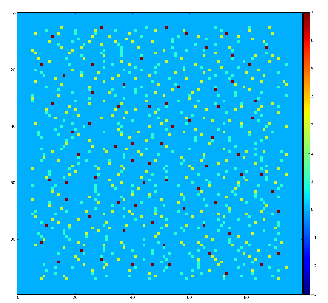
Maps of local maximums found for rank from 1 to 5
pixel color coding:
- blue=0 - not a local maximum
- green=1 - local maximum in row
- yellow=1+2 - local maximum in row and column
- red=1+2+4 - local maximum in rectangular region of radius=rank.
Table for rank, associated 2-d region size, and fraction of pixels recognized as local maximums.
| rank | 2-d region | fraction | time, ms | |
|---|---|---|---|---|
| 1 | 3x3 | 0.1062 | 5. | 07904 |
| 2 | 5x5 | 0.0372 | 5. | 02622 |
| 3 | 7x7 | 0.01320179 | 5.1 | |
| 4 | 9x9 | 0.00780104 | ||
| 5 | 11x11 | 0.0066 | 5.00515 |
Overview
Content Tools
