Page History
Test for 100x100 image with random normal distribution of intensities
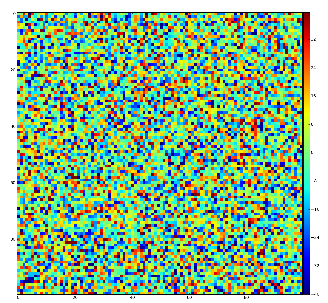
Maps of local peaks for rank from 1 to 5
![]()
![]()
![]()
![]()
![]()
pixel color coding:
- blue=
...
- 0 - not a local maximum
- green=1 - lacal maximum in row
- yellow=1+2 - lacal maximum in row and column
- yellow=1+2+4 - lacal maximum in rectangular region of radius=rank.
| rank | fraction |
|---|---|
| 1 | 0.0790 |
| 2 | 0.0262 |
| 3 | 0.0132 |
| 4 | 0.0078 |
| 5 | 0.0051 |
rank=2, fractions=[ 0.88222 0.04887 0. 0.04271 0. 0. 0. 0.0262 ]
rank=3, fractions=[ 0.92054 0.03319 0. 0.03305 0. 0. 0. 0.01322]
Overview
Content Tools