...
PingER simply reports whether there were duplicates or not. A useful metric is to report the number of pings received/number pings sent. The number received may depend on the ping command options. One option will send a given number of pings until it receives that many back or times out. Another option will send 10 pings and wait (or time out) until they are received. So the metric value may also depend on the ping command.
CERN
For each ping sent to www.cern.ch it responds with ~3 pings consistently. Using the normal traceroute www.cern.ch does not respond. Using the ICMP traceroute it does respond (twice). Pinging each node along the route using pingroute.pl (http:/http://www-dev.slac.stanford.edu/cgi-wrap/scriptdoc.pl?name=pingroute.pl) (unfortunately mtr does not report duplicates), it is seen that only www.cern.ch responds with duplicate packets.
Analysis of data in Jan 2015
We have data from PingER going back to 2005 which I have mined to look for DUP's. The input data is one line per set of pings made from SLAC to a remote host. The line indicates whether there were DUP’s. Each line is for a remote host monitored from SLAC with up to 10 successful (with a cut off at 30 tries) 100 Byte pings each 30 mins.
...
- The current number of countries with remote hosts being monitored is 171.
- The number of remote hosts being monitored in 2014 is 836.
- Of these, 81 recorded 1 or more lines (samples) with duplicate pings.
- There were 41 Malaysian hosts monitored, no exhibited duplicate pings.
- The major contributor since 2006 has been www.cern.ch, each year we see about 60 different hosts responding with DUPs.
- A list of the hosts responding with DUP pings in 2014 is below, followed by a summary of the annual DUP pings.
List of hosts responding with DUPlicate pings in 2014
- 2014: cbinet.bi seen duping 35 times
- 2014: internet.fo seen duping 6 times
- 2014: ms01.linea.gov.br seen duping 1 times
- 2014: ns.conacyt.gob.sv seen duping 3 times
- 2014: ping.cern.ch seen duping 450 times
- 2014: pinger.daffodilvarsity.edu.bd seen duping 2 times
- 2014: pinger.ictp.it seen duping 1 times
- 2014: pinger.numl.edu.pk seen duping 96 times
- 2014: pingerqta.pern.edu.pk seen duping 1 times
- 2014: www.acgrc.am seen duping 2 times
- 2014: www.afribone.net.gn seen duping 2 times
- 2014: www.afrinet.cd seen duping 8 times
- 2014: www.aic.ac.nz seen duping 1 times
- 2014: www.alard.ps seen duping 1 times
- 2014: www.bonesha.bi seen duping 73 times
- 2014: www.boz.zm seen duping 4 times
- 2014: www.cern.ch seen duping 14026 times
- 2014: www.cnrst.bf seen duping 43 times
- 2014: www.cyfronet.krakow.pl seen duping 1 times
- 2014: www.drtvnet.cg seen duping 12 times
- 2014: www.eritel.com.er seen duping 373 times
- 2014: www.gov.bw seen duping 635 times
- 2014: www.granma.cu seen duping 9 times
- 2014: www.hraparak.am seen duping 1 times
- 2014: www.ihep.su seen duping 1 times
- 2014: www.kcn.unima.mw seen duping 118 times
- 2014: www.lanl.gov seen duping 1 times
- 2014: www.lonab.bf seen duping 394 times
- 2014: www.lsx.com.la seen duping 1 times
- 2014: www.minzdrav.uz seen duping 12 times
- 2014: www.ml.refer.org seen duping 1 times
- 2014: www.nomad.mu seen duping 1 times
- 2014: www.rmutsv.ac.th seen duping 4 times
- 2014: www.rub.edu.bt seen duping 1 times
- 2014: www.stmaryuniversitycollege.edu.et seen duping 1 times
- 2014: www.uniswafoundation.org.sz seen duping 1 times
- 2014: www.univ-koudougou.bf seen duping 632 times
- 2014: www.univ-ouaga.bf seen duping 7 times
- 2014: www.uns.ac.id seen duping 2 times
- 2014: www.vnu.edu.vn seen duping 26 times
- 2014: www.vnuhcm.edu.vn seen duping 1 times
Summary of yearly data of DUP pings
See spreadsheet.
Year | DUPs | Hosts DUPing | Hosts monitored | Samples | % | CERN | Diff | % CERN |
2005 | 93 | 27 | 481 | 11408092 | 0.0008% | 0 | 93 | 0.00% |
2006 | 9228 | 40 | 514 | 13715929 | 0.0673% | 5751 | 3477 | 62.32% |
2007 | 35673 | 42 | 541 | 16315320 | 0.2186% | 34721 | 952 | 97.33% |
2008 | 39262 | 57 | 592 | 19680482 | 0.1995% | 34249 | 5013 | 87.23% |
2009 | 42356 | 52 | 663 | 17889767 | 0.2368% | 27469 | 14887 | 64.85% |
2010 | 74638 | 51 | 623 | 19862304 | 0.3758% | 19693 | 54945 | 26.38% |
2011 | 30769 | 79 | 659 | 22889278 | 0.1344% | 22518 | 8251 | 73.18% |
2012 | 85217 | 50 | 797 | 23786399 | 0.3583% | 34402 | 50815 | 40.37% |
2013 | 74128 | 76 | 774 | 25475771 | 0.2910% | 34916 | 39212 | 47.10% |
2014 | 16990 | 41 | 836 | 29933696 | 0.0568% | 14026 | 2964 | 82.55% |
2015 | 164 | 4 | 514773 | 0.0319% | 104 | 60 | 63.41% |
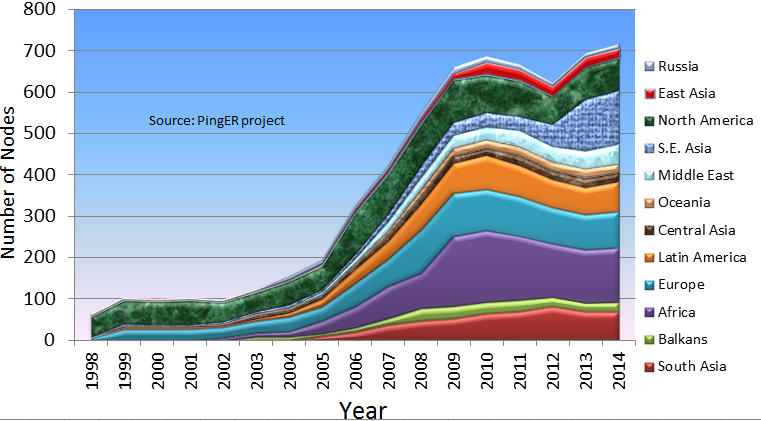
Distribution of Remote (monitored) hosts by country