...
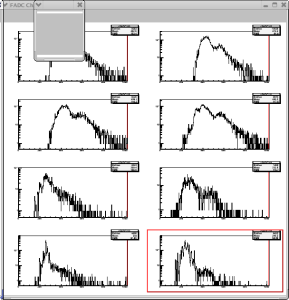
In this canvas are shown the charge raw data of the 4 SSDs modules
1-2 SSD0 Vertical - Horizontal
3-4 SSD1 Vertical - Horizontal
5-6 SSD2 Horizontal - Vertical
7-8 SSD3 Horizontal - Vertical
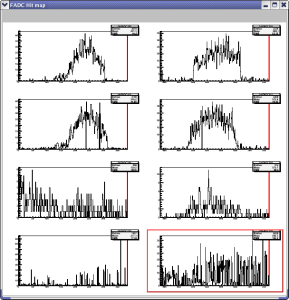
In this canvas are shown the hit maps of the 4 SSDs modules
1-2 SSD0 Vertical - Horizontal
3-4 SSD1 Vertical - Horizontal
5-6 SSD2 Horizontal - Vertical (the vertical plot is inverted up-down)
7-8 SSD3 Horizontal - Vertical (the vertical plot is inverted up-down)
!FADCWeight.png|thumbnail,align=left!In this canvas are shown the hit maps whighted with the charge of the 4 SSDs modules
The plot is refrashed at each spill
1-2 SSD0 Vertical - Horizontal
...
5-6 SSD2 Horizontal - Vertical (the vertical plot is inverted up-down)
7-8 SSD3 Horizontal - Vertical (the vertical plot is inverted up-down)
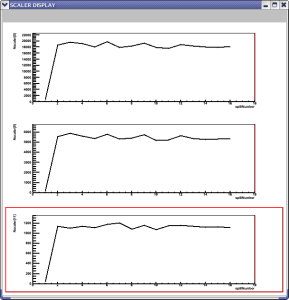
In this canvas are shown the scaler counts for 3 relevant ch.
1) S0 counts per cycle (to monitor all beam intensity)
2) S0*C1*C2 counts per cycle (to monitor the elctron content of the beam)
3) HW Triggers per cycle (to monitor the acqusition rate)